🚀 10x easier, 🚀 140x lower storage cost, 🚀 high performance, 🚀 petabyte scale - Elasticsearch/Splunk/Datadog alternative for 🚀 (logs, metrics, traces).
OpenObserve Cloud | Docs | Slack | Website
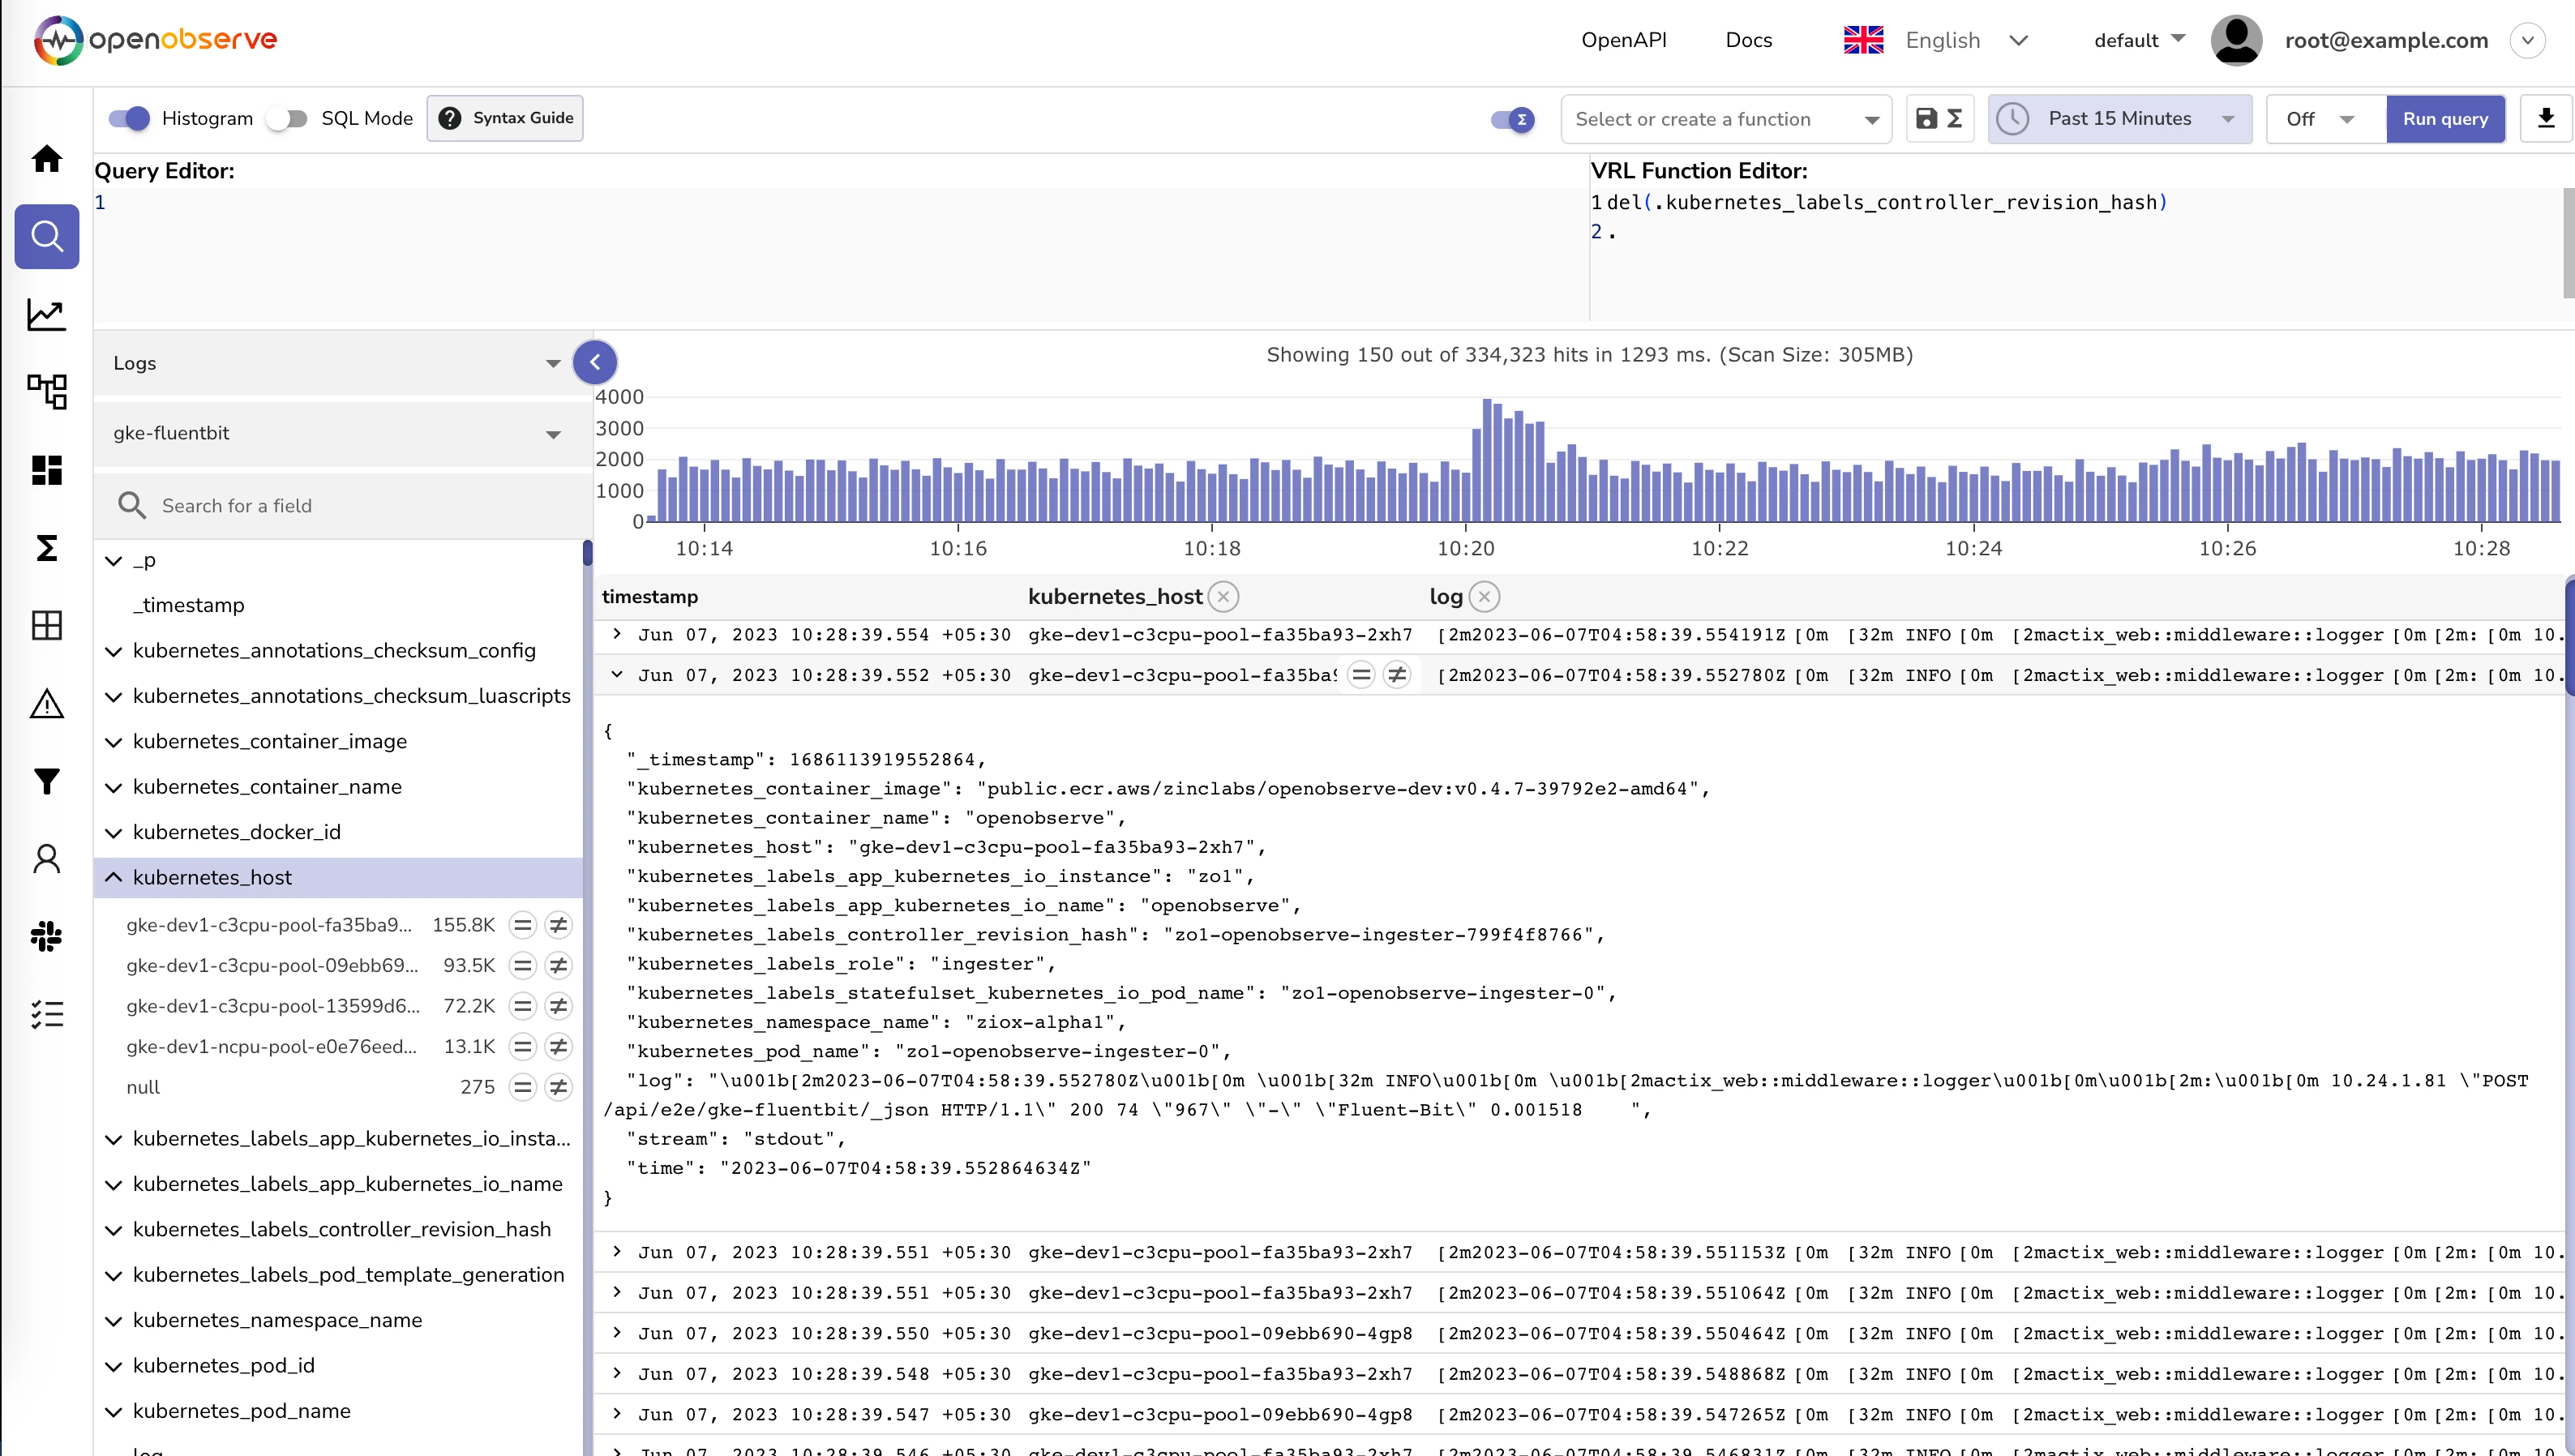
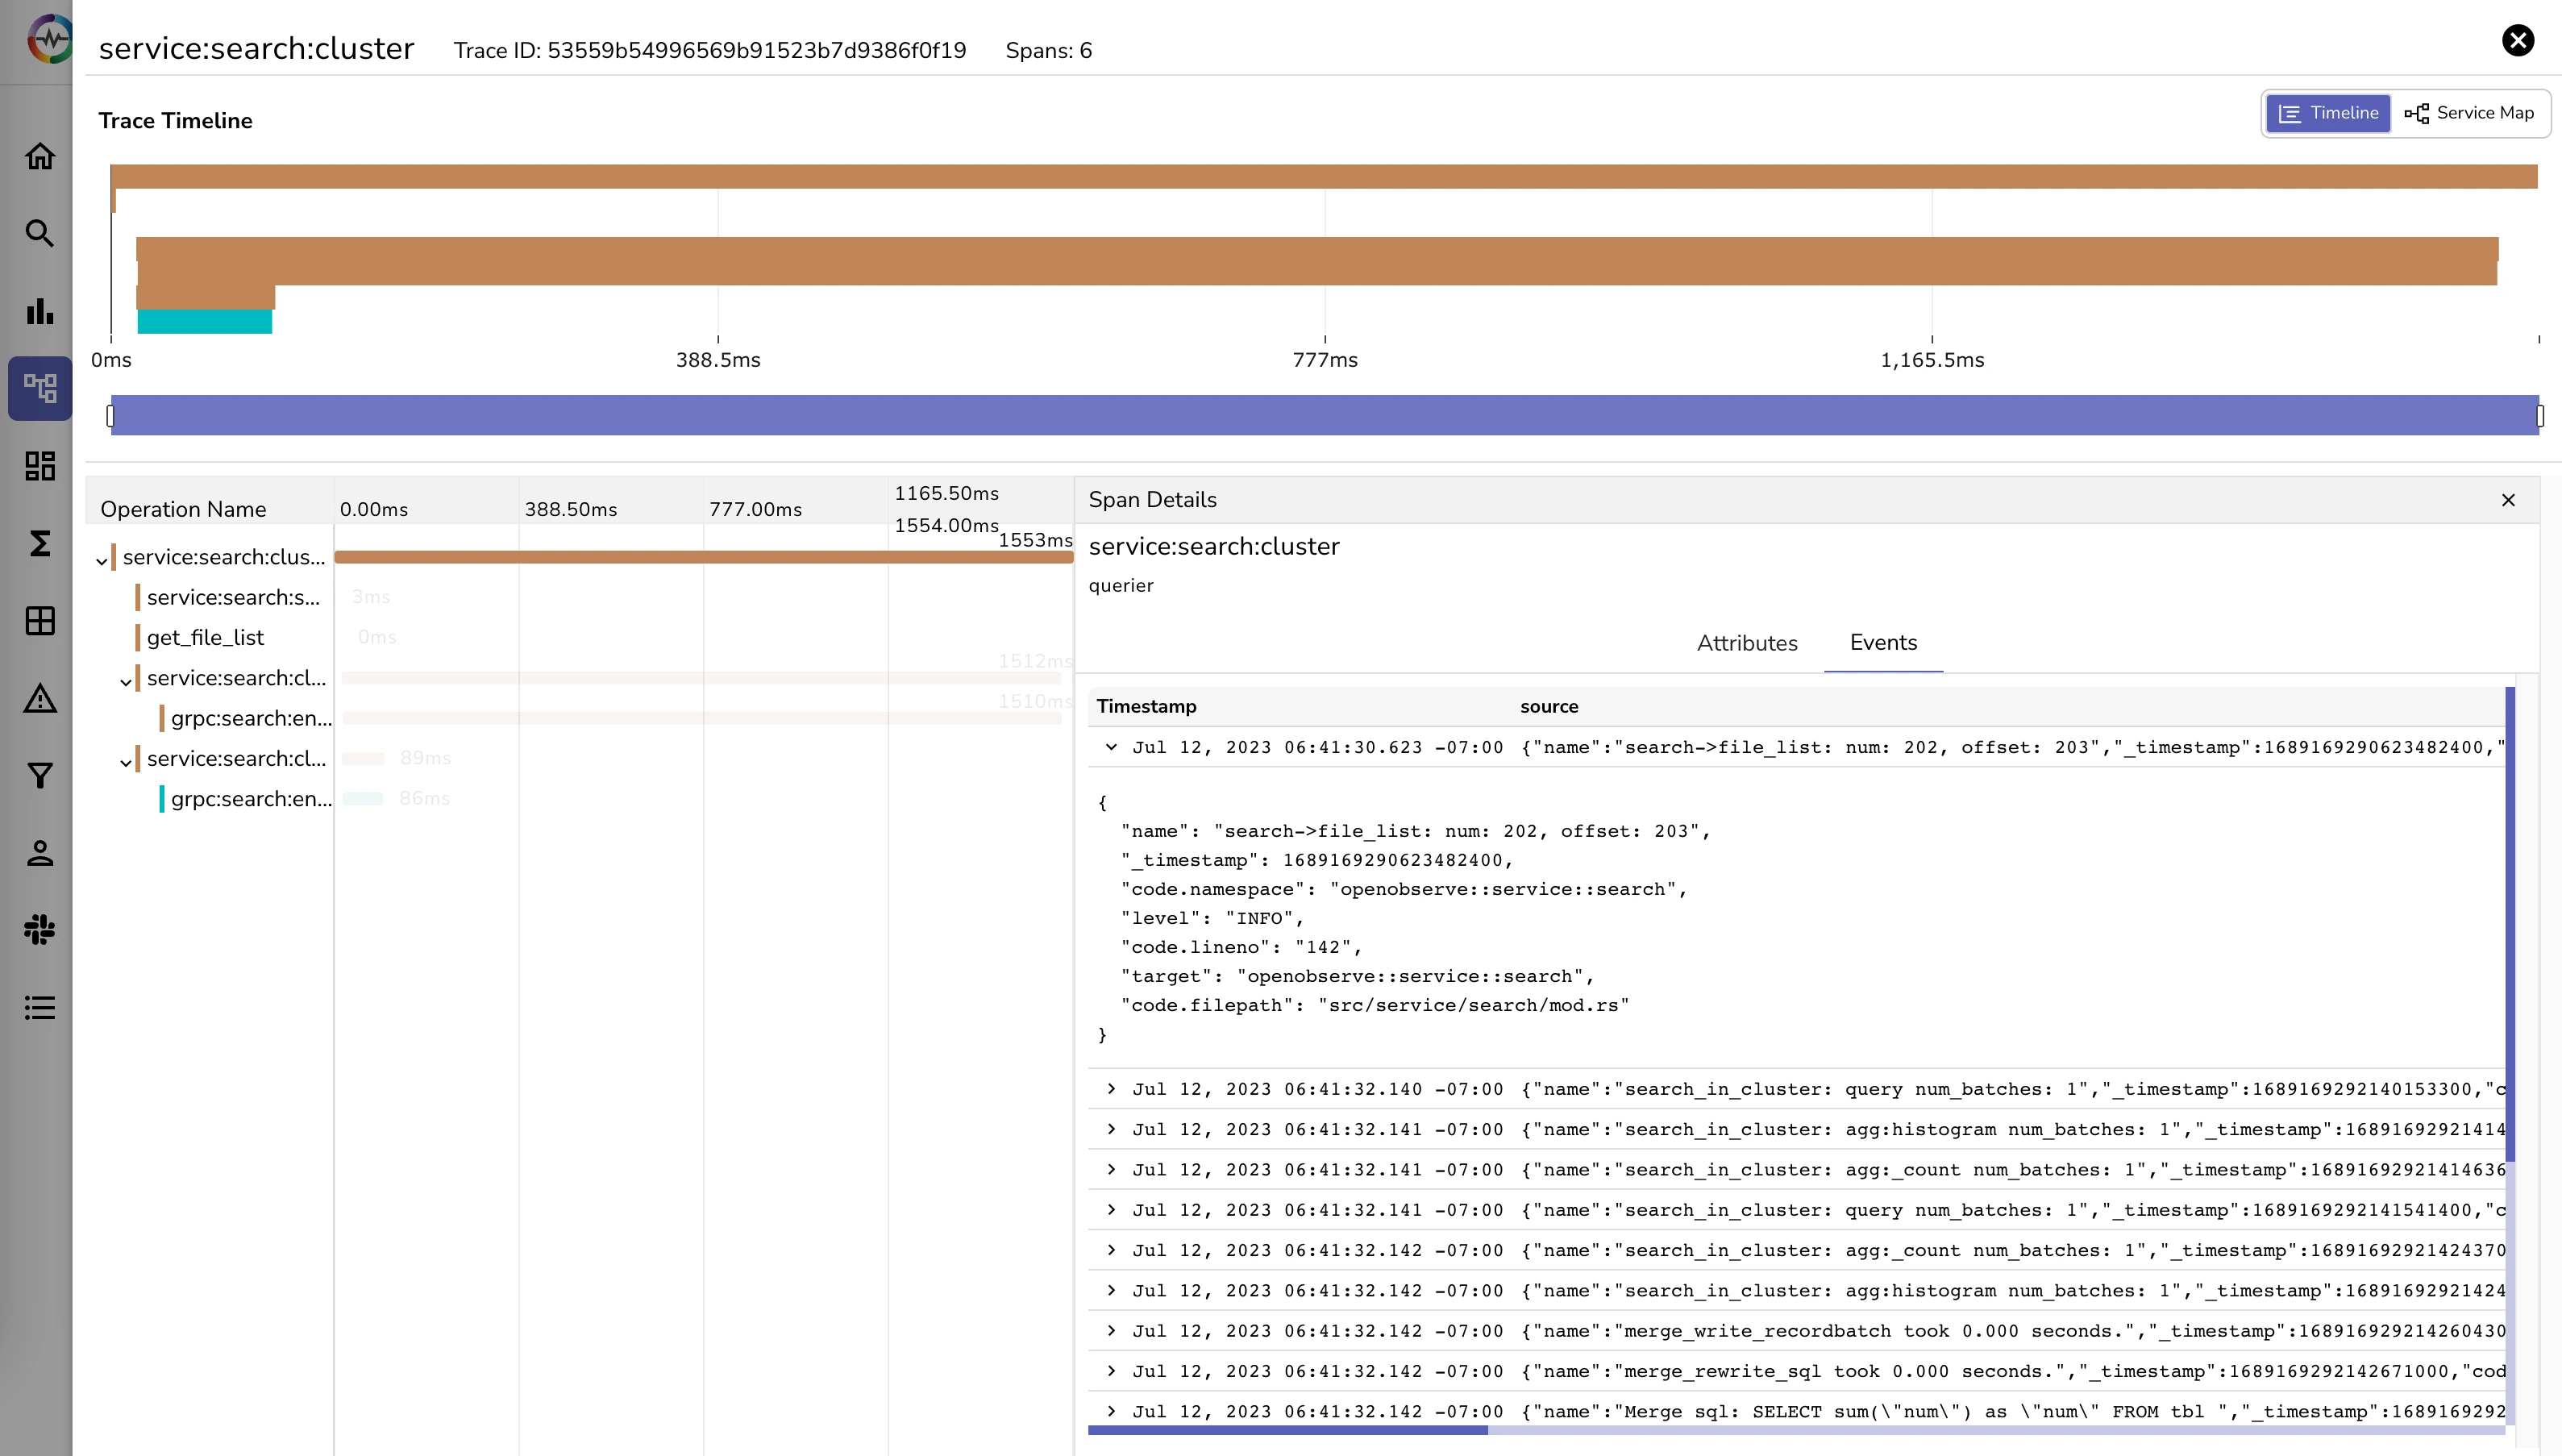
OpenObserve is a cloud native observability platform built specifically for logs, metrics, traces and analytics designed to work at petabyte scale.
It is very simple and easy to operate as opposed to Elasticsearch which requires a couple dozen knobs to understand and tune which you can get up and running in under 2 minutes.
It is a drop-in replacement for Elasticsearch if you are just ingesting data using APIs and searching using kibana (Kibana is not supported nor required with OpenObserve. OpenObserve provides its own UI which does not require separate installation unlike kibana).
You can reduce your log storage costs by ~140x compared to Elasticsearch by using OpenObserve. Below are the results when we pushed logs from our production kubernetes cluster to Elasticsearch and OpenObserve using fluentbit. OpenObserve stored data in Amazon s3 and Elasticsearch stored data on Amazon EBS volumes.
OpenObserve_Introduction.mp4
Some of the features are:
- Logs, Metrics, Traces
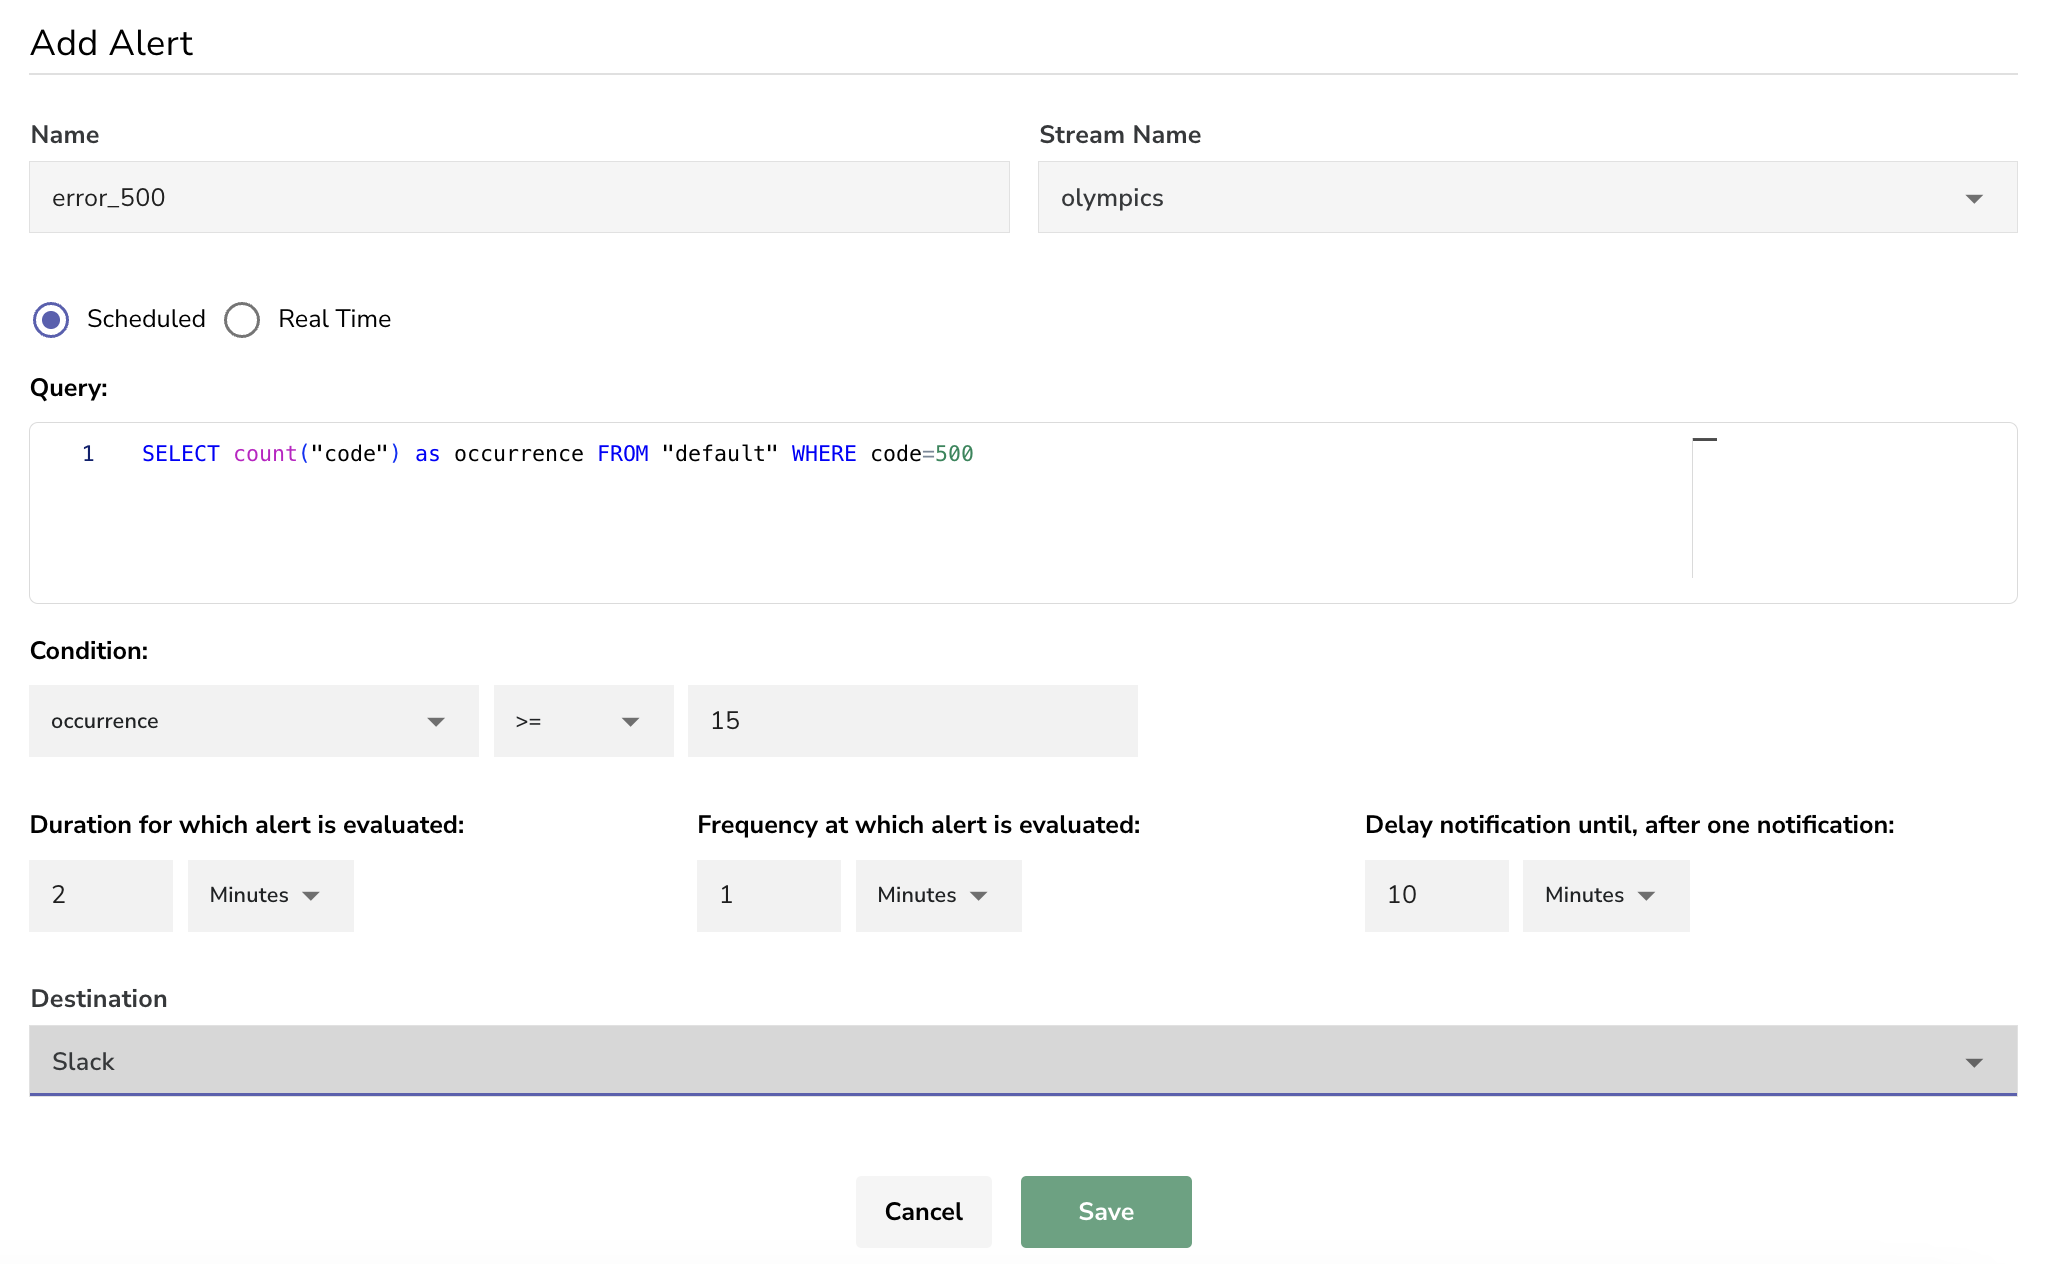
- Alerts, Dashboards
- Ingest and Query functions to aid advanced capabilities like enrichment, redaction, log reduction, compliance, etc. e.g. you can use ingest functions to redact sensitive data like email IDs, AWS keys, etc. from logs before the get stored in logs.
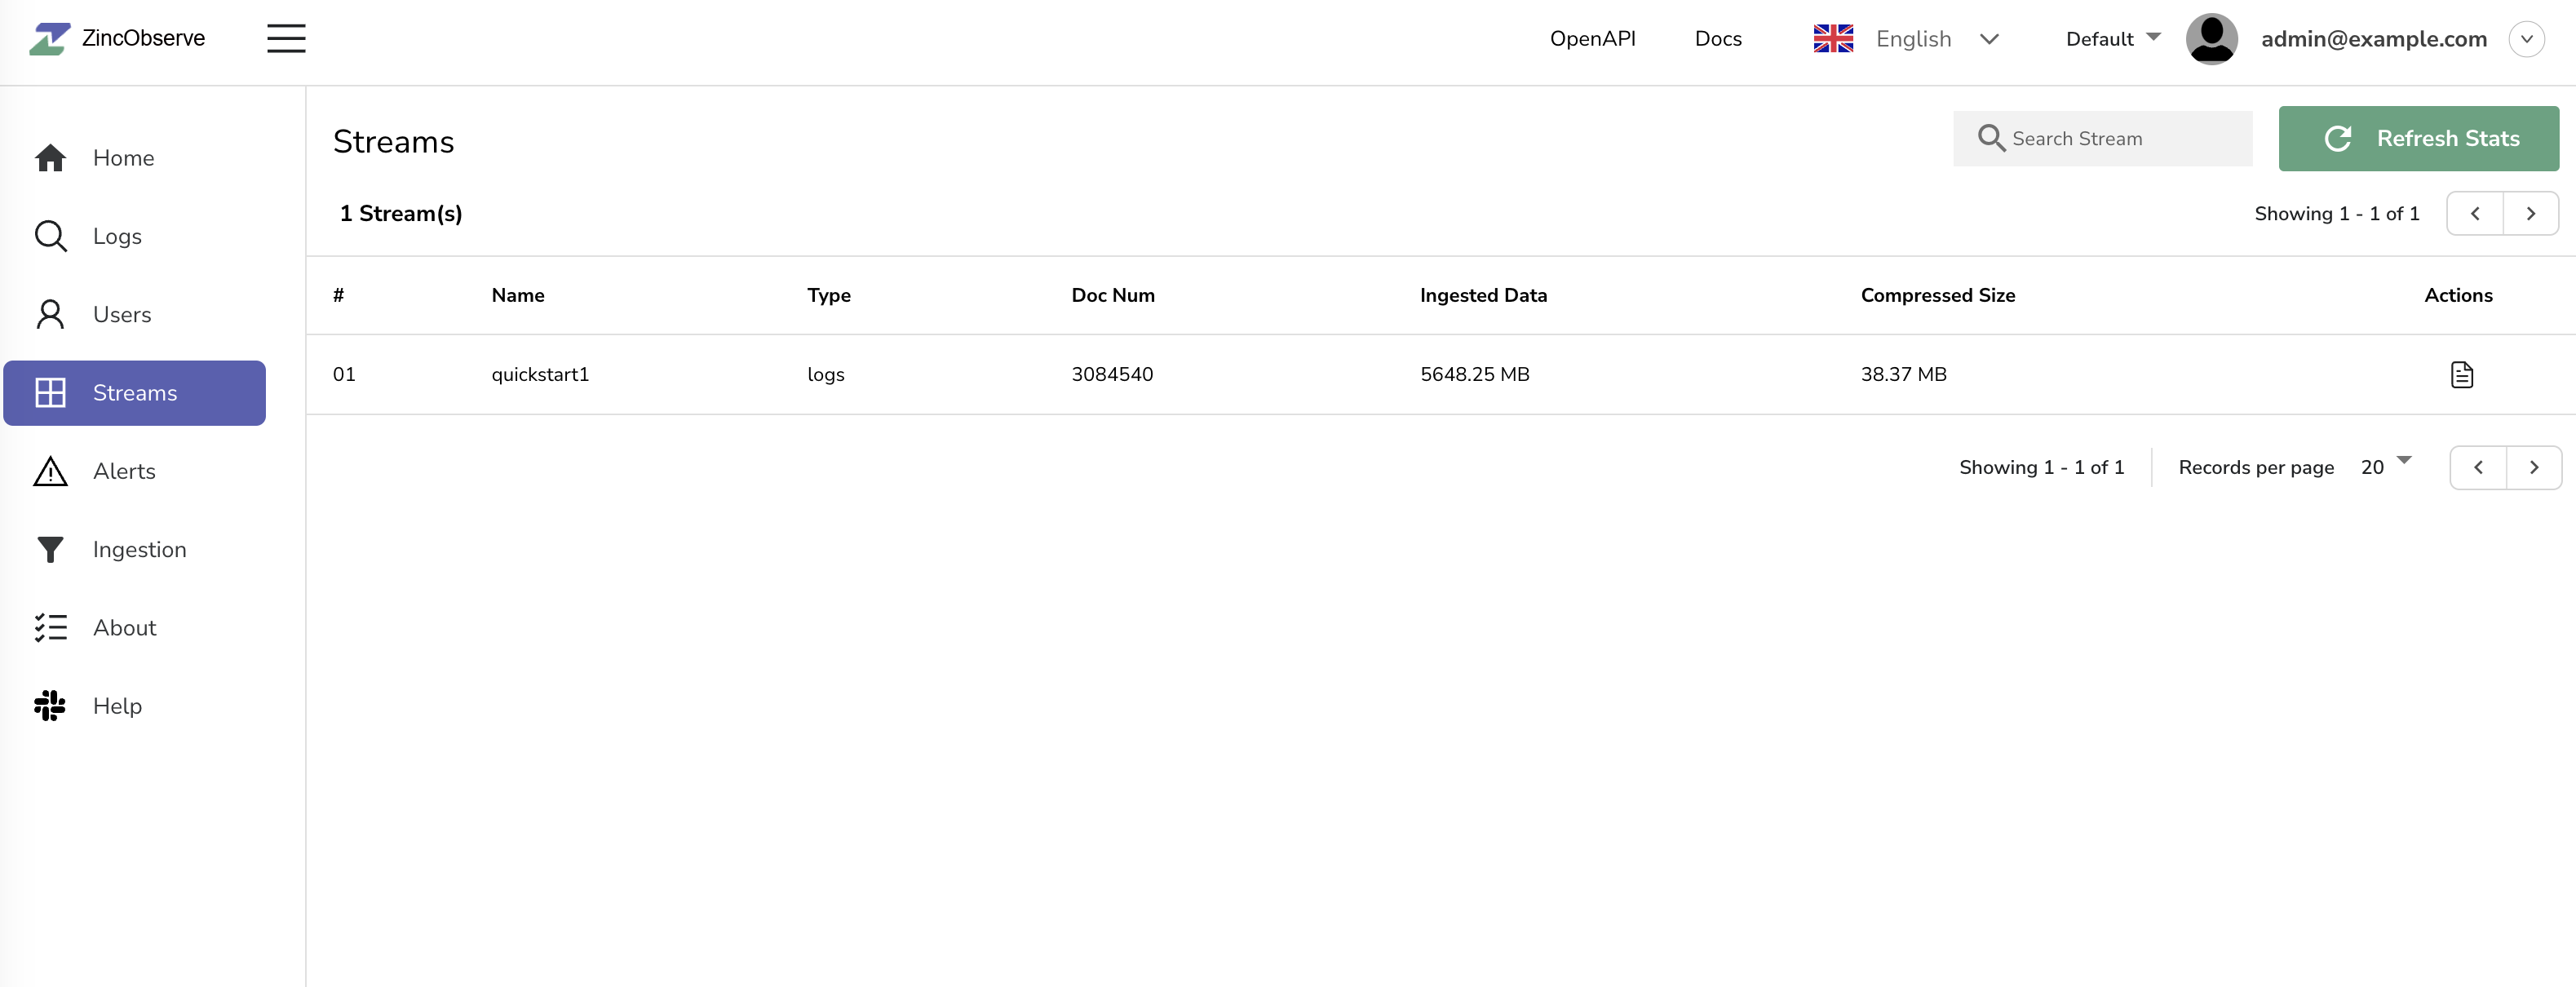
- Advanced Embedded GUI
- SQL for Logs and Traces. SQL and PromQL for metrics. No need to learn yet another query language.
- Single binary for installation & running. Binaries available under releases for multiple platforms.
- Storage in local Disk, s3, MinIO, GCS
- High availability and clustering
- Drop in replacement for elasticsearch
- Dynamic Schema
- Out of the box authentication
- Vastly easier to operate
- Seamless upgrades
For full list of features check documentation
You can install OpenObserve in under 2 minutes by following the quickstart documentation
You can also try OpenObserve without installing it in under 2 minutes by trying out OpenObserve Cloud at https://cloud.openobserve.ai
-
Check the contributing guide . Also check the roadmap items
-
Easiest way to get support is to join the Slack channel.
-


