Sentry is a DevOps monitoring system that collect time series data, store data in TSDB, display data with dashboard and send alert to users.
- simple architecture
- use push mode to collect metric data
- use an agent to collect system metrics
- use sentry-sdk to collect application metrics, sdk can send metrics to server directly
- a dashboard to display time series metrics
- sentry-alarm can send four type of alarm: heartbeat, threashold, compare and TopN

- Go to TDengine install page to download the latest package for your OS and install it
- Go to MySQL download to downlad the package for your OS and install it
- Go to golang download to downlad the package for your OS and install it
- git clone https://github.com/sentrycloud/sentry.git
- cd sentry/tools
- ./build.sh
- MySQL setup:
- mysql> source configs/create_tables.sql;
- TDengine setup:
- taos> CREATE USER sentry PASS '123456';
- taos> CREATE DATABASE IF NOT EXISTS sentry KEEP 60 DURATION 5;
- tar zxvf sentry_server.tar.gz -C ~/
- cd ~/sentry_server
- ./sentry_server
If everything is OK, it alrealy collect metrics of its own, visit: http://localhost:51001 for following snapshot:

- tar zxvf sentry_agent.tar.gz -C ~/
- cd ~/sentry_agent
- ./sentry_agent
After a while, you can change the dashboard list to machine monitor:

The sentry frontend is at https://github.com/sentrycloud/sentry-frontend,
npm run build, then move build direntory to frontend to update the web UI
What you want to measure in quantity in a time series, if you want to measure server status, the the metrics are cpu, memory, disk, etc.
Tags are the labels attached to the metric, if the metric is server cpu, tags maybe IDC, IP, AppName, etc.
DownSample is the time interval than aggregate a series of data point to a single data point
DownSampe method for four type of aggregation: sum, avg, max, min
The time series metric value represent by a pair of (timestamp, value)
-
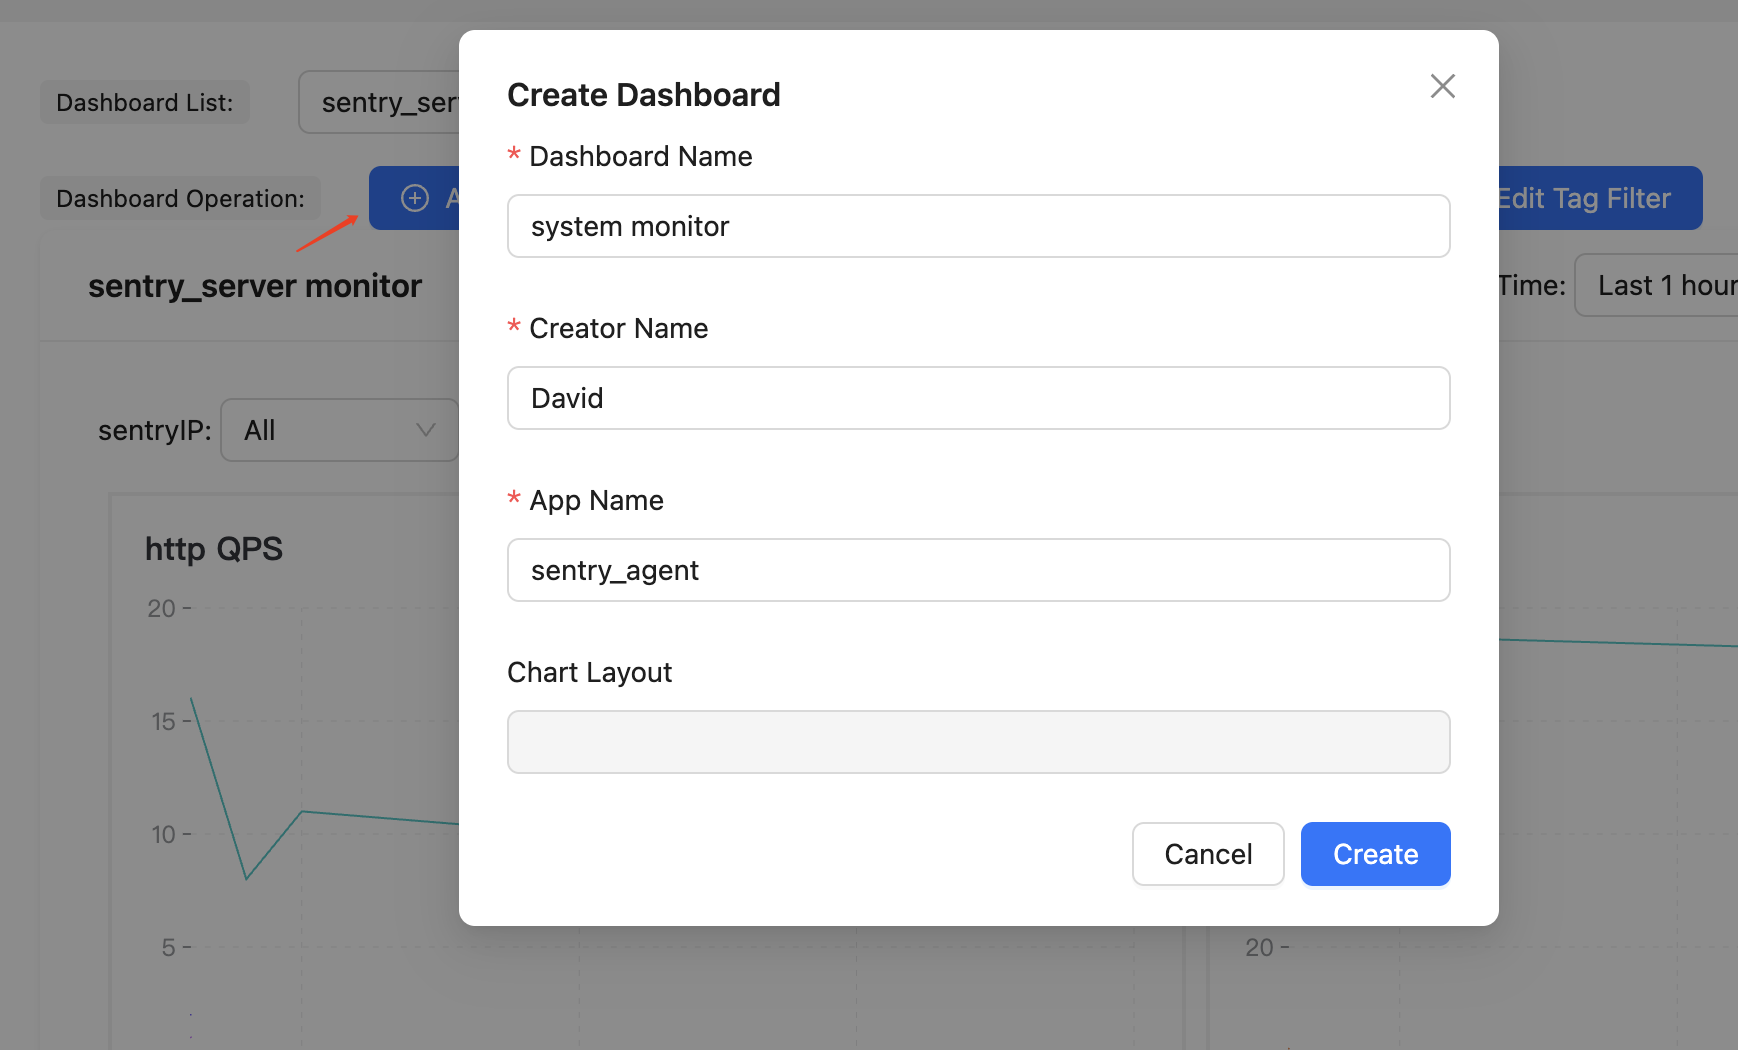
Add a new dashboard named "system monitor", if add success it will navigate to the new created empty dashboard
-
In the new dashboard click the Add Chart Button, it will navigate to a config page to setup the new chart
-
Setup the new chart configurations, after save it will navigate back to the dashboard

-
New chart in the dashboard

-
Click the change/save layout button to drag and resize the charts in the dashboard


- add more sentry-sdk for other language
- add more metric collectors for most common systems - Redis, MySQL, Kafka, etc.
- use embeded TSDB and repalce MySQL with SQLite, so sentry-server can be a standalone server