Simple playground to try together combination of awesome tools: Grafana 6 + Loki + Prometheus.
# Start
git clone https://github.com/shadinua/demo-grafana-loki-prometheus
cd demo-grafana-loki-prometheus
docker-compose up

# Stop
^C
docker-compose downThis playground contains:
loki- storage for logspromtailthat scrapes logs from your/var/logdirectory and puts tolokicadvisor- exports metrics of running docker containersprometheus- storage for metrics, get metrics fromcadvisor, interface: http://localhost:9090grafanawith pre-configured both datasources —lokiandprometheus, interface: http://localhost:3000,admin/test
- new
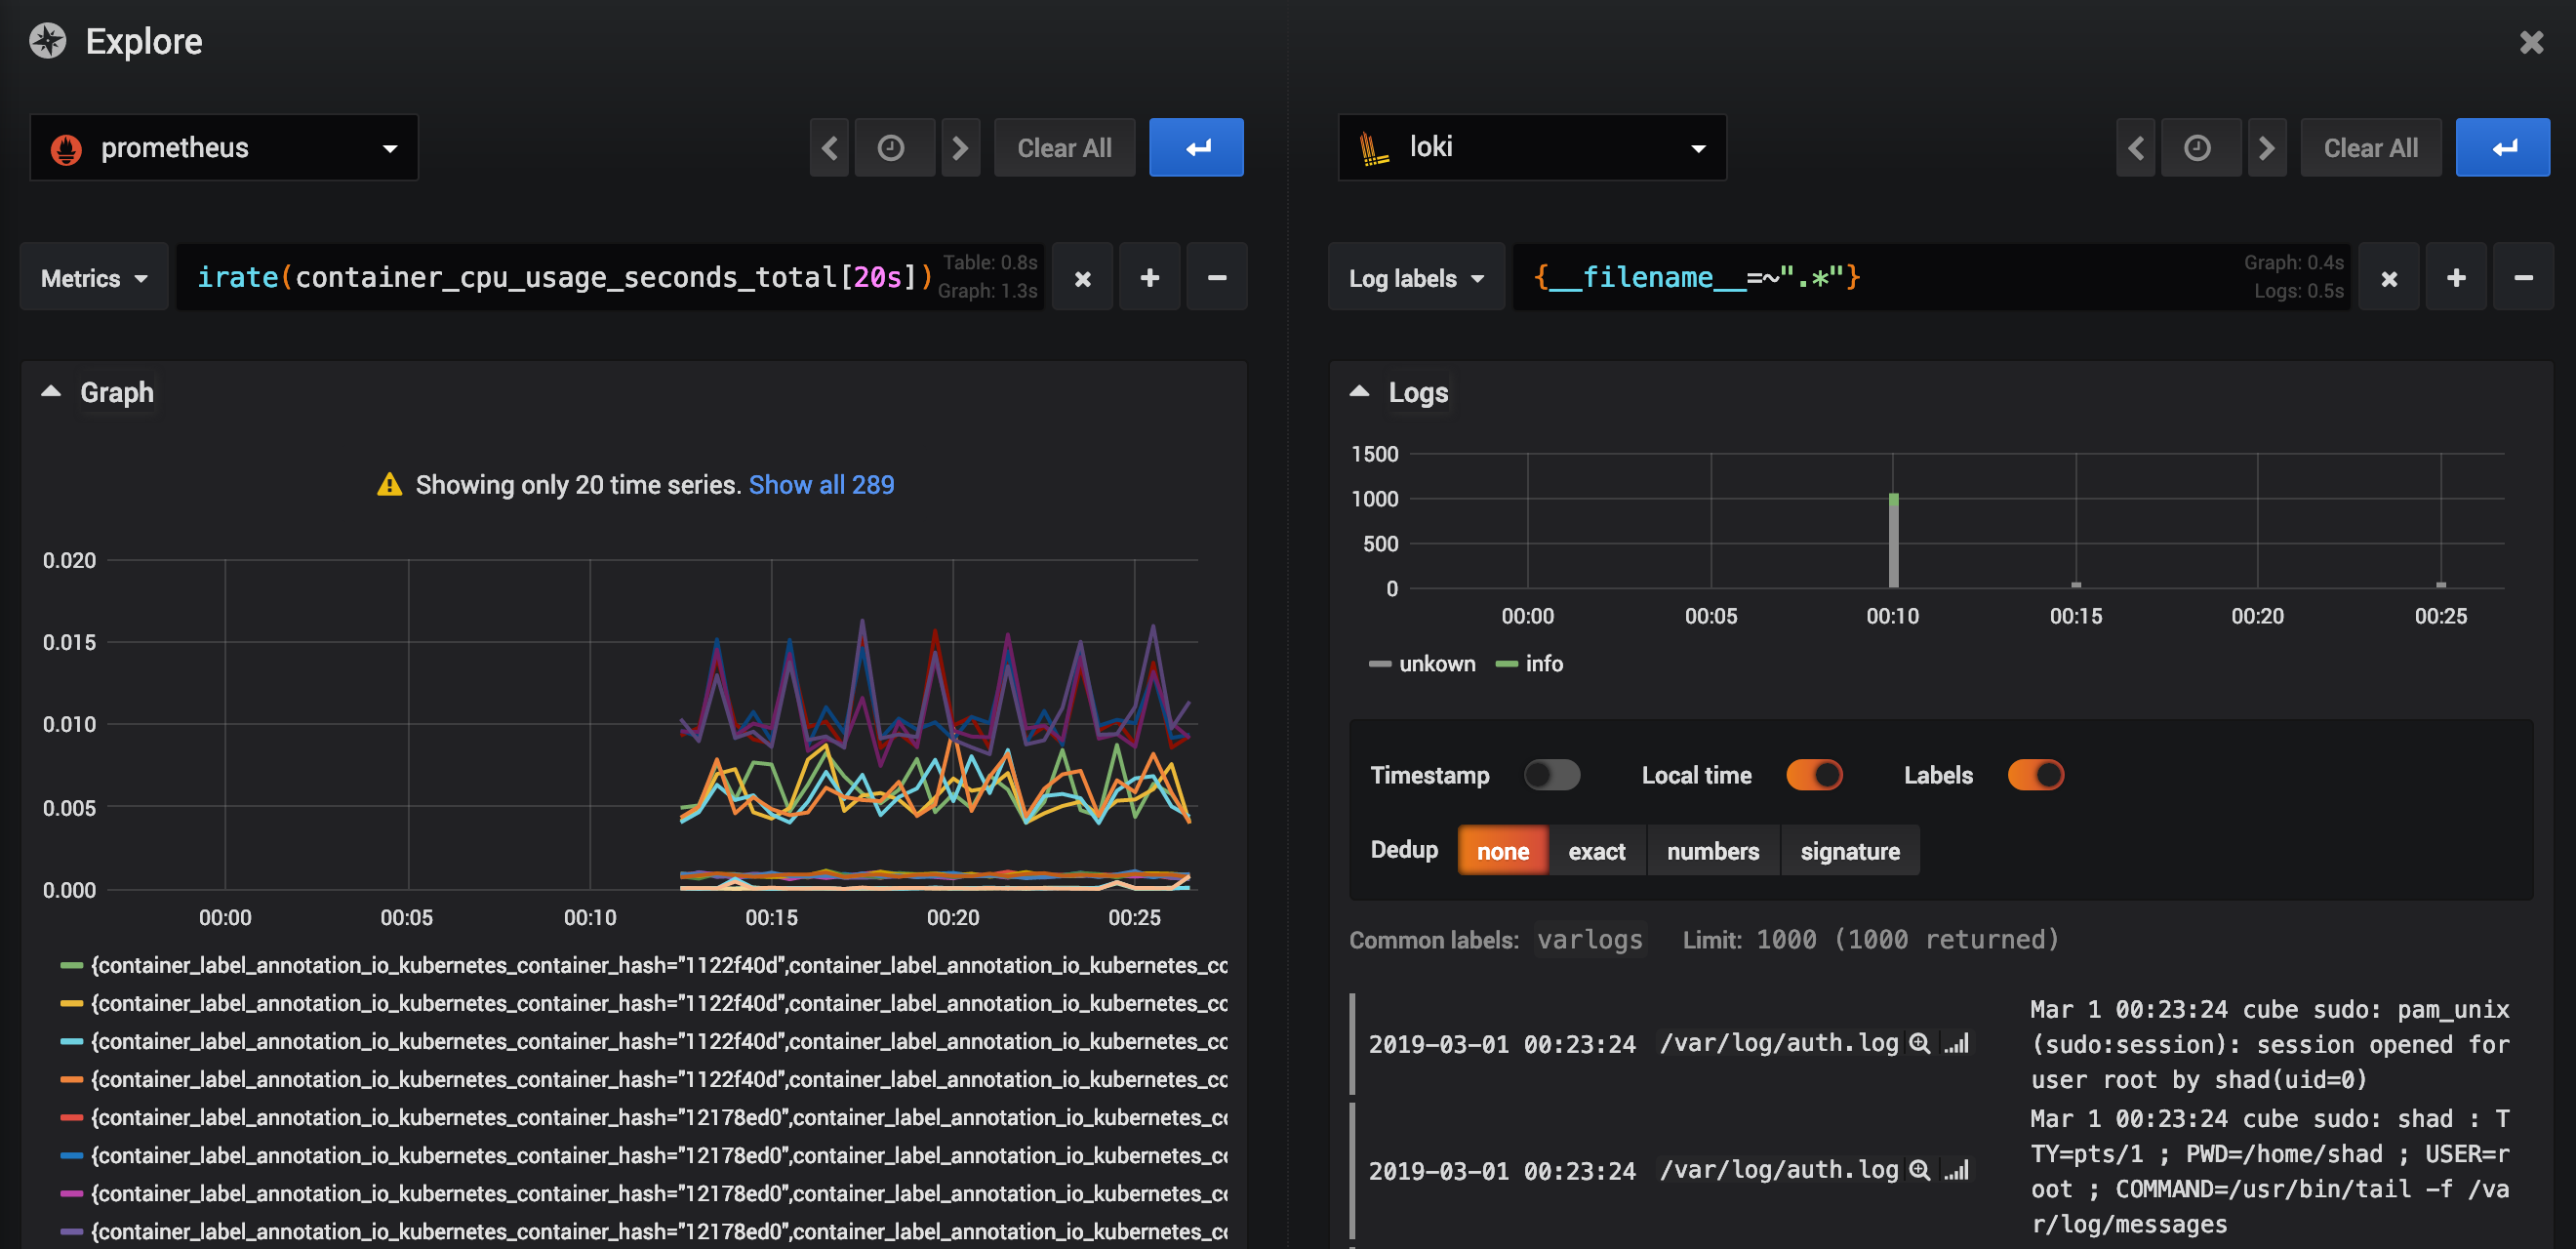
explorepanel: fast search for data, debug, easily play without creating complex dashboards - split screen: nice mode, where you can simultaneously see, for example,
prometheusmetrics at the left panel andlokilogs on the right - queries to
prometheus:irate(container_cpu_system_seconds_total[20s])container_memory_rss- ...
- queries to
loki{job="varlogs"}{__filename__="/var/log/syslog"}- ...
- create dashboards
- ... many many more ...
