This repo defines a generative Christmas card for 2023 for plotting on an iDraw v2.0 plotter (mine is A3).
-
Install the homebrew dependencies, from the root of the repo:
brew bundle
-
Make sure you have a python environment:
pyenv install 3.11.6
pyenv virtualenv 3.11.6 christmas2023
-
Install the python dependencies:
pip install -r requirements.txt
-
Check that you can generate a single card design:
python generative_tree.py
-
That should have generated files under output/layers and output/post-processing. You can now plot the files in output/post-processing on your plotter.
-
If you want to generate a 2-up (A4) or 4-up (A3) set of cards, you can run:
python multicard.py
The multicard.py script generates a set of files in output/grid which are designed to be plotted with an iDraw plotter.
As well as a multilayer SVG file it also generates a set of iDraw v2 specific gcode files. These can be sent directly to the plotter using the gcode-cli tool.
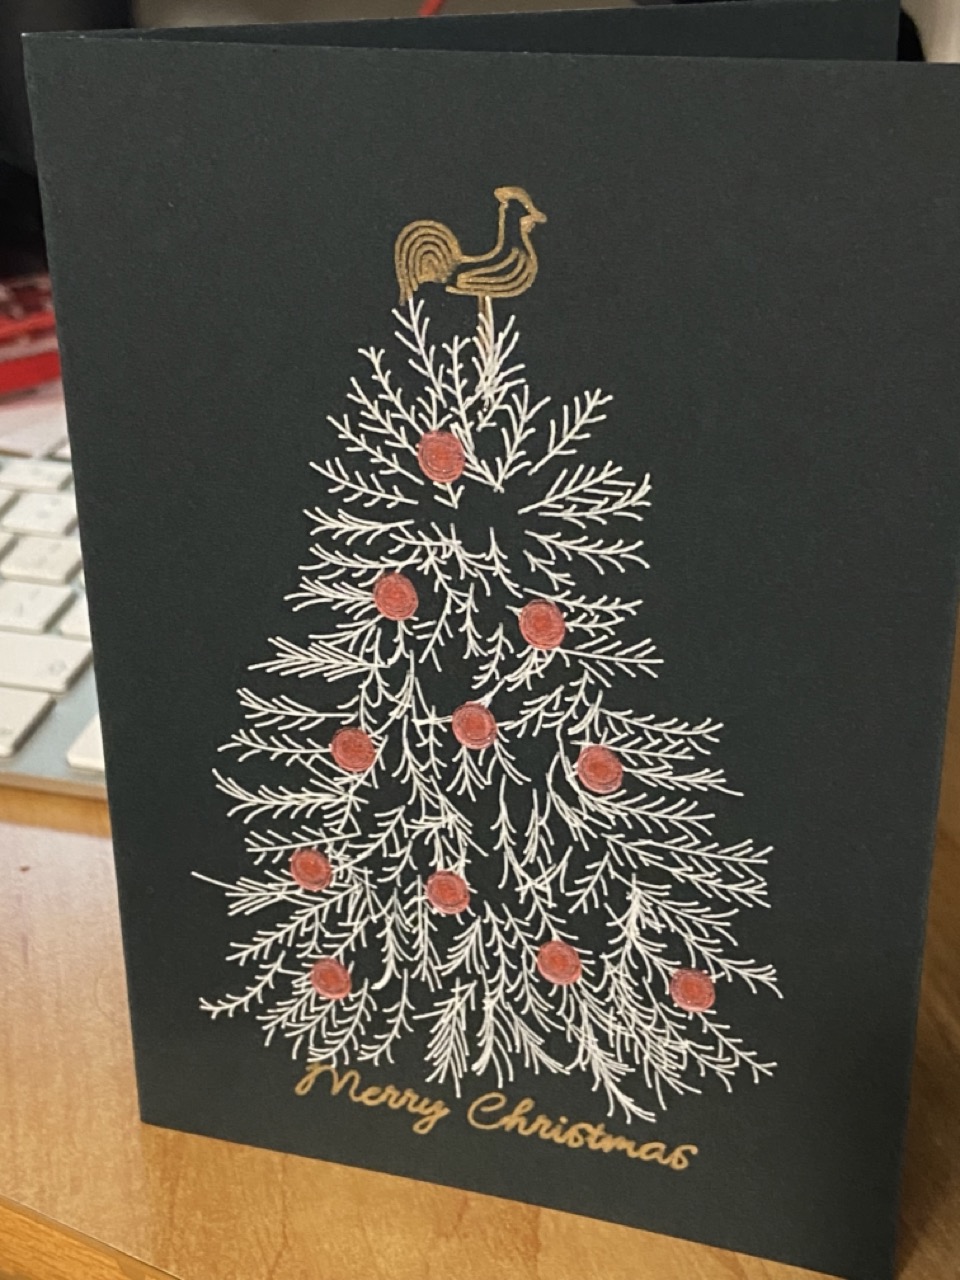
The design is intended to be plotted on dark card (I used a dark green). The layers should be plotted as follows:
- Layer 1: Use a gold pen for this, it's a cockerel from a church local to me and "merry christmas"; I'm using a gold metallic gelly roll pen.
- Layer 2: This is the main tree and a little credit. I'm using a 0.8 white gelly roll pen.
- Layer 3: This is the baubles on the tree. You can use any colour you like, I'm using a red glitter gelly roll pen, although I've found that plotting this in white first and then going over it with the red glitter pen gives a better result.
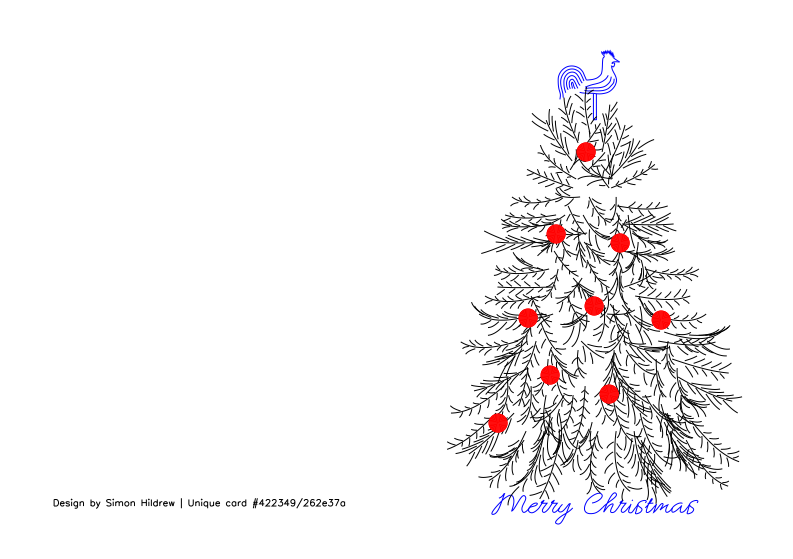
This is the (rendered) output of a single combined and optimised A6 size folded card (A5 front and back):
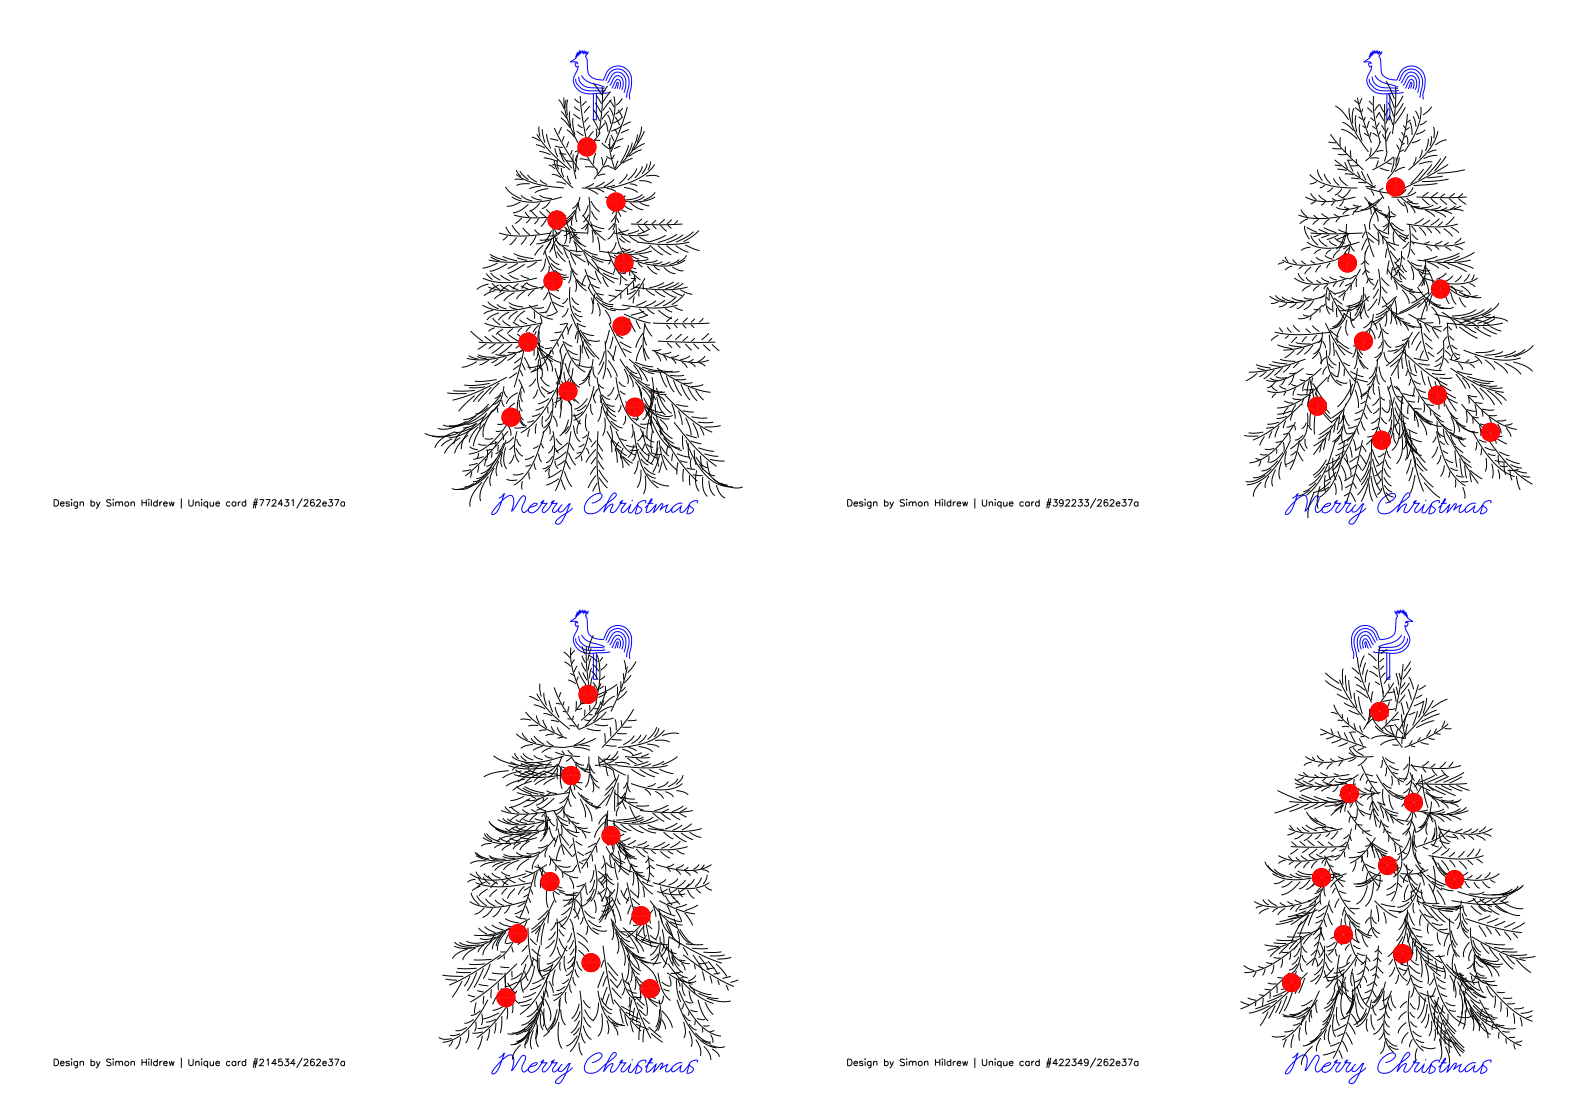
This is four cards assembled to fill the A3 size of my plotter:
This is a photograph of a final version plotted with the gold, white and red pens described above:
Unlike the original iDraw, the iDraw v2.0 plotter is not compatible with the AxiDraw software as they switched from the EBB protocol to use gcode instead. There is scant information on the internet about this, although this and this have proved very helpful whilst trying to work things out.
In the end I landed on using the following flow:
- py5 to generate the SVG files (although I'd consider exploring vsketch in the future)
- I'm using this somewhat unconventionally by accruing instructions in a list and then actually applying them against py5 towards the end; this allows me to write objects into different layers at any time and then do the generation later
- vpype to post-process the SVG files and convert it into gcode using vpype-gcode (most of the config magic for this is in the
vpype.tomlfile) - gcode-cli to send the gcode to the plotter (on a raspberry pi)
I made some changes to the Inkscape extension (see resources/drawcore_serial.py.patch for the patch against the latest extension as of Nov '23) to log the gcode that it was sending to the plotter in order to get the output from vpype to be as close as possible to what the Inkscape extension was sending. I've checked in a copy of the resulting serial conversation between the Inkscape extension and plotter as resources/inkscape_output.log for reference.
Some key thoughts:
$His the command to auto home the plotter into the top left corner- the inkscape extension issues
$SLPat the end of any action which de-energises the motors, so I've added that to the end of the gcode output from vpype - the input needs to be portrait A3 (for my iDraw v2.0 A3 plotter at least)
- the start point of my plotter is the top right corner, which doesn't seem to follow any convention I've seen elsewhere
- in principle, I could start to plot form anywhere, but Inkscape seems to always start from the top right corner so I'm going to stick with that
- the inkscape extension uses mm for units but never seems to send the command to specify this
- the inkscape extension uses relative positioning for XY
- the inkscape extension uses absolute positioning for Z (pen up/down) with 0.5mm being up and 5mm being down
- I've used relative positioning for the most part, except to return the pen to the origin at the end of the plot
- the final output compares very well with the output from the Inkscape extension


