Tracee is a lightweight and easy to use container and system tracing tool. It allows you to observe system calls and other system events in real time. A unique feature of Tracee is that it will only trace newly created processes and containers (that were started after Tracee has started), in order to help the user focus on relevant events instead of every single thing that happens on the system (which can be overwhelming). Adding new events to Tracee (especially system calls) is straightforward, and will usually require no more than adding few lines of code.
Tracee CLI was originally written in Python, but was since ported to Go. Currently both versions are still available in the repo, but future development will be in Go and the Python version will eventually be deprecated and removed.
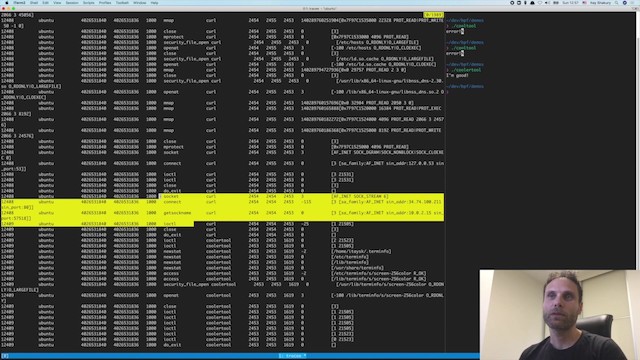
Check out this quick demo of tracee:

To run, Tracee requires the following:
- Linux kernel version > 4.14
- Kernel headers
- C standard library (currently tested with glibc)
- BCC
You can get Tracee in any of the following ways:
- Download the binary from the GitHub Releases tab (
tracee.tar.gz). - Use the docker image from Docker Hub:
aquasec/tracee. The image already includes libc and bcc but you will need to mount the kernel headers in (see below for example). - Build from source, using
make build(or via Docker usingmake build-docker).
If run Tracee binary, you'll need to run it with root permissions in order to load the eBPF code.
If you use the Docker container, you should run it with the --privileged flag.
We will use the Tracee Docker image, which includes glibc and BCC. The host that Docker is running on needs to satisfy the other requirements, kernel version and kernel headers. If you use a recent version of Ubuntu, you are good to go as it satisfies those requirements, but any other Linux distribution will work as well. To run Tracee using docker:
docker run --name tracee --rm --privileged -v /lib/modules/:/lib/modules/:ro -v /usr/src:/usr/src:ro aquasec/tracee:latestThis will run Tracee with no arguments which will collect all events from all newly created processes and print them as a table to the standard output.
Here is how the output looks:
TIME(s)        UTS_NAME         MNT_NS       PID_NS       UID    EVENT            COMM             PID    TID    PPID   RET          ARGS
133            ubuntu           4026531840   4026531836   1000   execve           zsh              2944   2944   2571   0           [/usr/bin/ls [ls]]
133            ubuntu           4026531840   4026531836   1000   security_bprm_check zsh              2944   2944   2571   0           [/usr/bin/ls]
133            ubuntu           4026531840   4026531836   1000   access           ls               2944   2944   2571   -2          [/etc/ld.so.preload R_OK]
133            ubuntu           4026531840   4026531836   1000   security_file_open ls               2944   2944   2571   0           [/etc/ld.so.cache O_RDONLY|O_LARGEFILE]
133            ubuntu           4026531840   4026531836   1000   openat           ls               2944   2944   2571   3           [-100 /etc/ld.so.cache O_RDONLY|O_CLOEXEC]
133            ubuntu           4026531840   4026531836   1000   mmap             ls
...
Each line is a single event collected by Tracee, with the following information:
- TIME - shows the event time relative to system boot time in seconds
- UTS_NAME - uts namespace name. As there is no container id object in the kernel, and docker/k8s will usually set this to the container id, we use this field to distinguish between containers.
- MNT_NS - mount namespace inode number.
- PID_NS - pid namespace inode number. In order to know if there are different containers in the same pid namespace (e.g. in a k8s pod), it is possible to check this value
- UID - real user id (in host user namespace) of the calling process
- EVENT - identifies the event (e.g. syscall name)
- COMM - name of the calling process
- PID - pid of the calling process
- TID - tid of the calling thread
- PPID - parent pid of the calling process
- RET - value returned by the function
- ARGS - list of arguments given to the function
- Use
--helpto see a full description of all options. Here are a few commonly useful flags: --containertraces only newly created containers, ignoring processes running directly on the host. This only shows processes created in a different mount namespace from the host.--eventallows you to specify a specific event to trace. You can use this flag multiple times, for example--event execve --event openat.--listlists the events available for tracing, which you can provide to the--eventflag.--outputlets you control the output format, for example--output jsonwill output as JSON lines instead of table.
When Tracee reads information from user programs it is subject to a race condition where the user program might be able to change the arguments after Tracee has read them. For example, a program invoked execve("/bin/ls", NULL, 0), Tracee picked that up and will report that, then the program changed the first argument from /bin/ls to /bin/bash, and this is what the kernel will execute. To mitigate this, Tracee also provide "LSM" (Linux Security Module) based events, for example the bprm_check event which can reported by tracee and cross-referenced with the reported regular syscall event.