##Introduction
Peronal Finance overview Dashboard to analyze Finnancial spending pattern and take to support critical Financial Decisions.
Analysis on Historical Financial Data from Transactions Data obtained from Bank Statements and Stock Broker Order Books.
Salient Features:
- Dashboard to view Financial Status (Assets and Debt).
- View Spending pattern for historical Data.
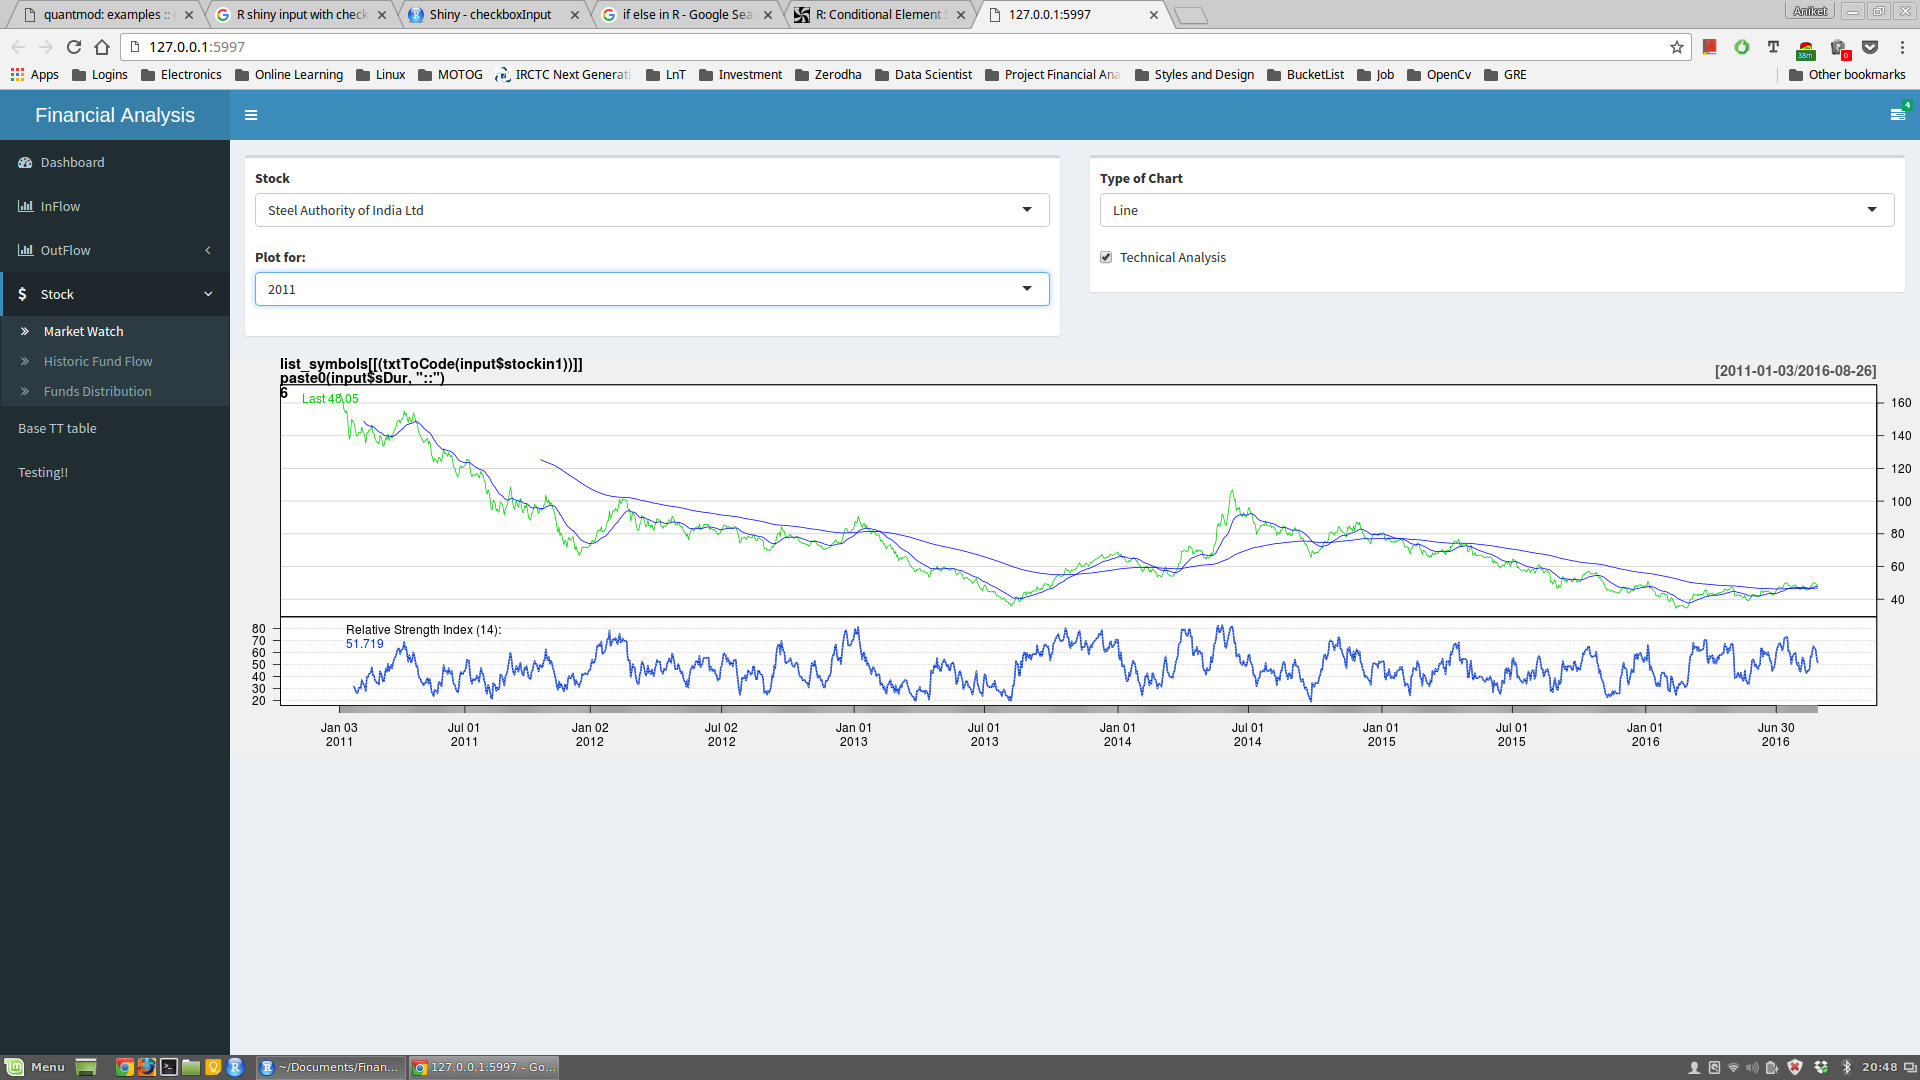
- View stock market data for selected scripts.
- View Techinal Indicators for the selected stock script.
Techincal Details:
- Uisng R to process csv files that have bank transactions and Stock Order Book.
- Using quantmod package to fetch historical data from Yahoo Finance for stocks.
- Using Shiny Dashboard as Front End Tool to create dashboard and display relevant plots.
##Installation
- Install R
- Install RStudio
- Download Project Folder from GitHub
- Create csv files as per your requirement (Sample Provided)
- Edit csv file location from file loadcsv.R in Project folder.
- Install Dependencies for Project from RStudio.
$ install.packages(xts)
$ install.packages(Quandl)
$ install.packages(quantmod)
$ install.packages(stringr)
$ install.packages(dplyr)
$ install.packages(tidyr)
$ install.packages(lubridate)
$ install.packages(scales)
$ install.packages(PerformanceAnalytics)
$ install.packages(ggplot2)
$ install.packages(shiny)- Run program financial_analysis_backend.R to proccess Data.
- Run Dashboard/app.R to initiate launch of Front End tool.
##Screenshots of Dashboard
