Load and visualize OpenSky Network air traffic data with Python framework (geo/pandas, contextily...)
Air traffic data are either provided as JSON files from the OpenSky live REST API or requested to the OpenSky historical database with Paramiko
Flight data are stored as pandas / GeoPandas dataframes
The map background is built with contextily
Images are built with PIL and Matplotlib
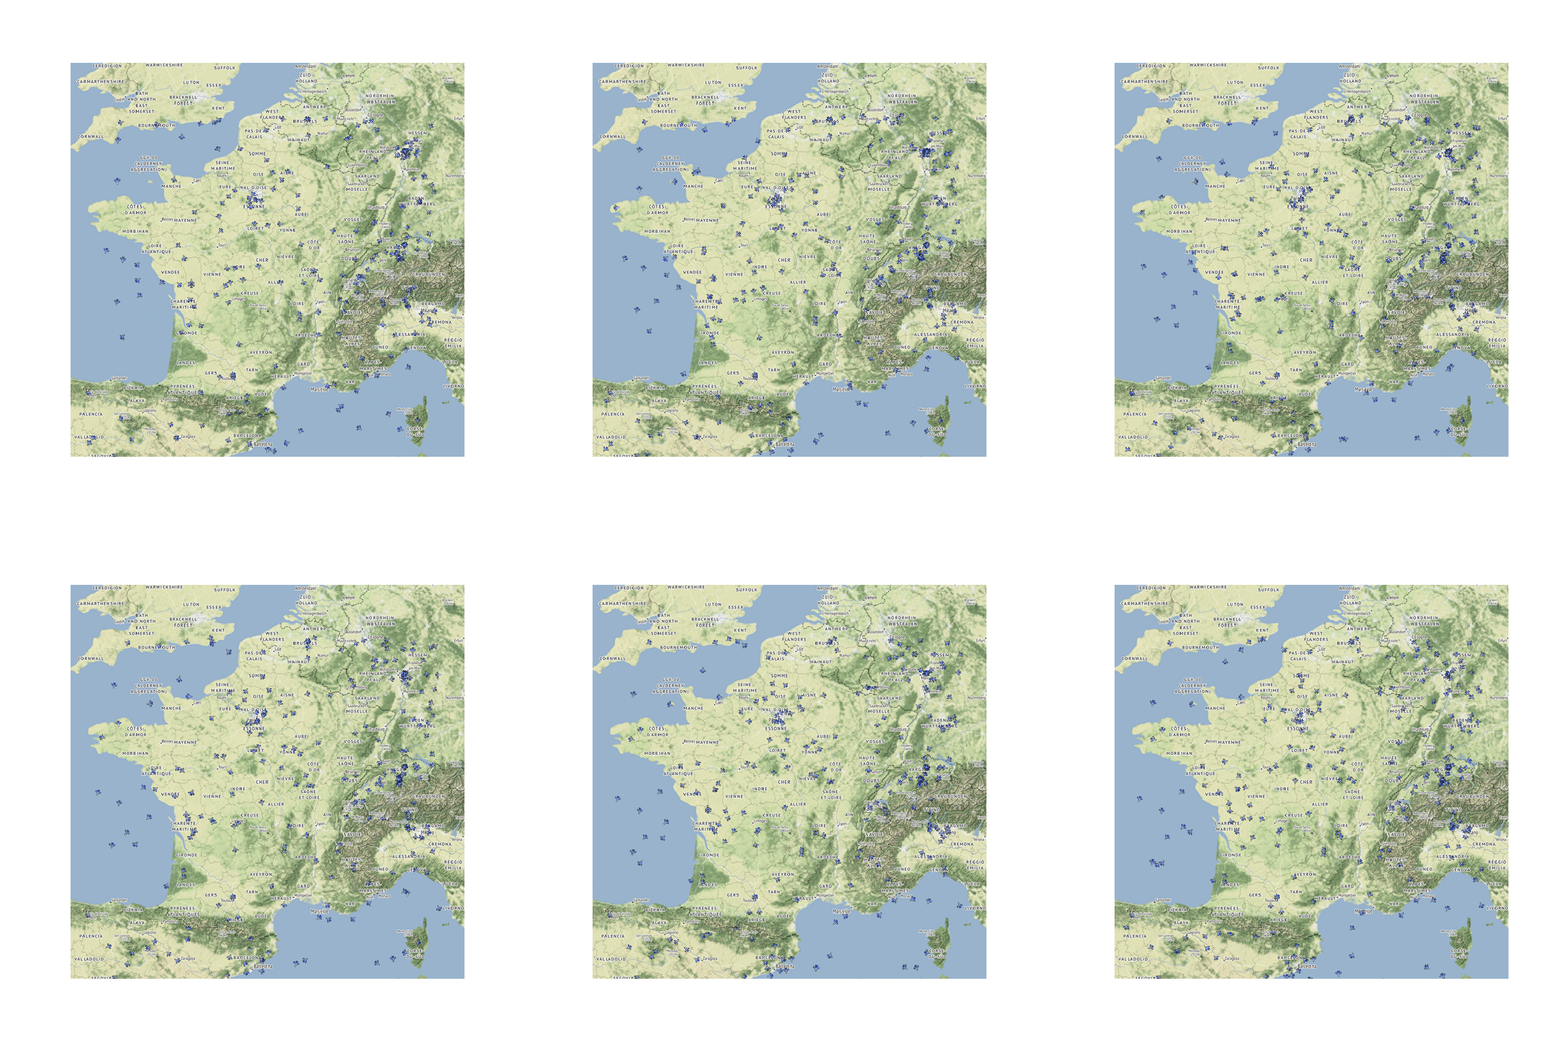
Example: plot latest tracks over France (10 positions in the last 10 minutes)
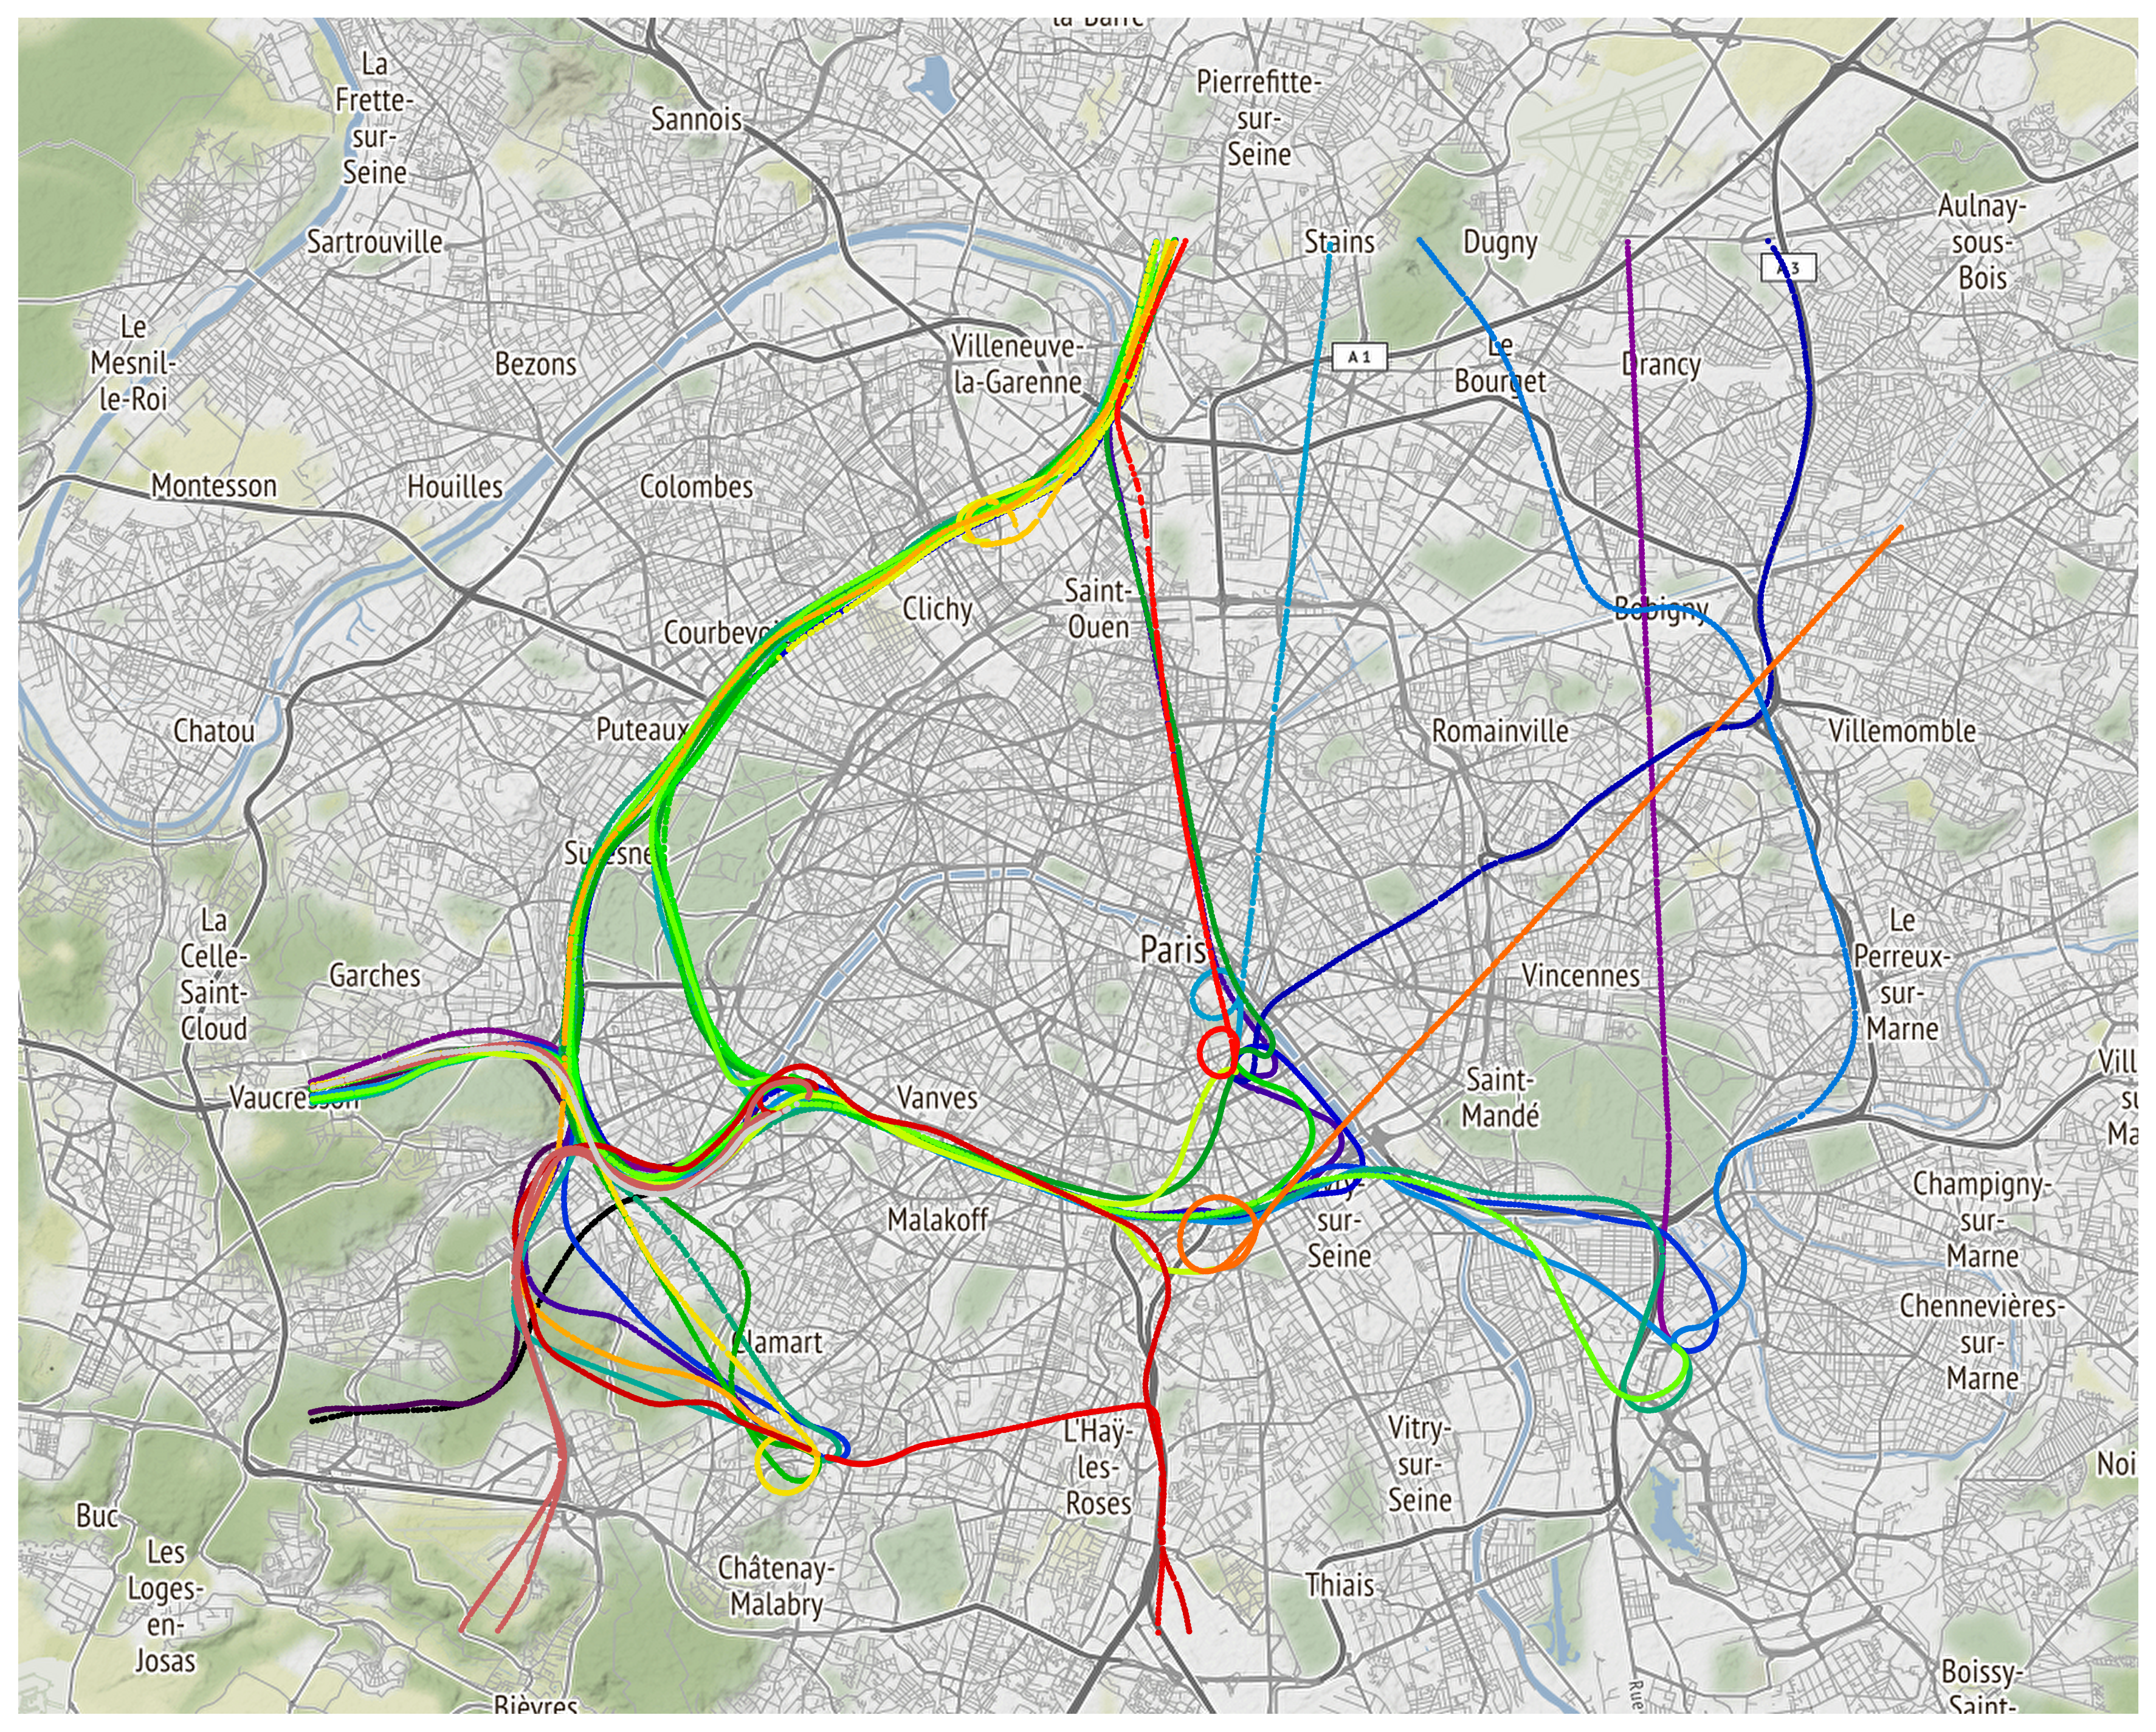
Example 2: plot trajectories of emergency helicopters over Paris (summer 2020)

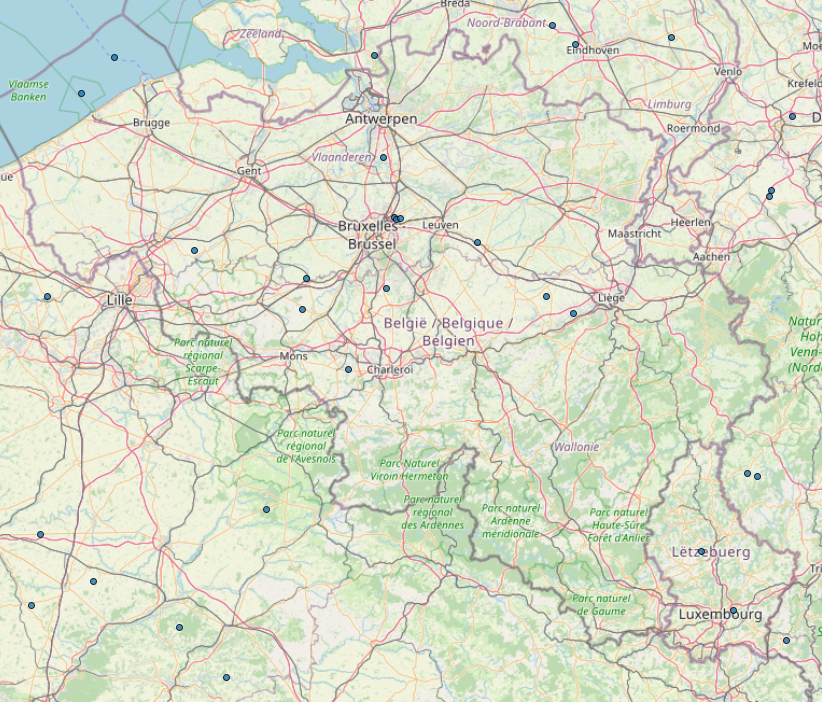
Example 3: plot latest positions of flights over Belgium

Run the different notebooks to load and visualize data:
-
demo_unauthenticated_instant: load and visualize rapidly on a map latest flight positions (ex: over Belgium)
-
demo_authenticated_latest: load and visualize successive positions from recent flight positions (ex: over France)
-
demo_historical_database: load and visualize past flight trajectories (ex: emergency helicopters over Paris)
-
Paramiko - A Python implementation of SSHv2
-
pandas - Python Data Analysis Library
-
GeoPandas - GeoPandas is an open source project which extends the datatypes used by pandas to allow spatial operations on geometric types.
-
contextily - Context geo-tiles in Python
Code tested with the following configuration: Python 3.7.4, paramiko 2.7.2, pandas 0.25.1, geopandas 0.6.3 and contextily 1.0rc2
- Thomas Dubot
This project is licensed under the MIT License - see the LICENSE.md file for details
If you fail adapting these scripts to your needs, you could try to install one of the following Python libraries to access OpenSky Network data:
