This repository is one deployment of Airflow, a data orchestration tool, from the official apache/airflow image in Docker with reporting dashboards setup in Grafana. To configure Airflow metrics to be usable in Grafana, the following tools are also used: StatsD, StatsD-Exporter, and Prometheus. The setup is described below. Associated blog post here.
Additionally, this repository showcases an example of a scalable DAG folder and code architecture, discussed in my Airflow Summit 2021 talk, Writing Dry Code in Airflow.
Now, you may ask, what's the motivation for monitoring Airflow with external resources, instead of using the UI? I answer a question with a question: how would you be notified if the scheduler queue was filled and no tasks were executing, or the scheduler went down? Without this architecture, notifications of that kind would not be intuitative to setup.
All of the services are run as separate containers, with Airflow using multiple containers (described below).
The resources are located at the following URLs:
- Airflow Webserver UI: http://localhost:8080
- StatsD Metrics list: http://localhost:9123/metrics
- Prometheus: http://localhost:9090
- Grafana:
- URL: http://localhost:3000
- Login: username = admin, password = password
- Dashboards: http://localhost:3000/dashboards
- Datasources: http://localhost:3000/datasources
- URL: http://localhost:3000
The Airflow containers are built using the official apache/airflow Docker image, version 2.0.0. This contains significant updates when compared to the puckel/docker-airflow image. This repository can be compared to the puckel/docker-airflow repository to indicate changes needed to migrate to the official image, but the main differences are also outlined below.
There are several Airflow containers including Redis, Postgres, the Webserver, and the Scheduler. On the webserver and scheduler, a sample DAG is loaded from the dags/ folder. The current deployment uses the CeleryExecutor; the metrics have not been tested with the KubernetesExecutor.
Airflow emits metrics in the StatsD format automatically, if certain environment variables (starting with AIRFLOW__SCHEDULER__STATSD_) are set. More information on StatsD found here.
The StatsD-Exporter container converts Airflow's metrics in StatsD format to Prometheus format, the datasource for Grafana. More information on StatsD-Exporter found here.
Prometheus is a service commonly used for time-series data reporting. It is particularly convenient when using Grafana as a reporting UI since Prometheus is a supported datasource. More information on Prometheus found here.
Grafana is a reporting UI layer that is often used to connect to non-relational databases. In this exercise, Grafana uses Prometheus as a datasource for building dashboards.
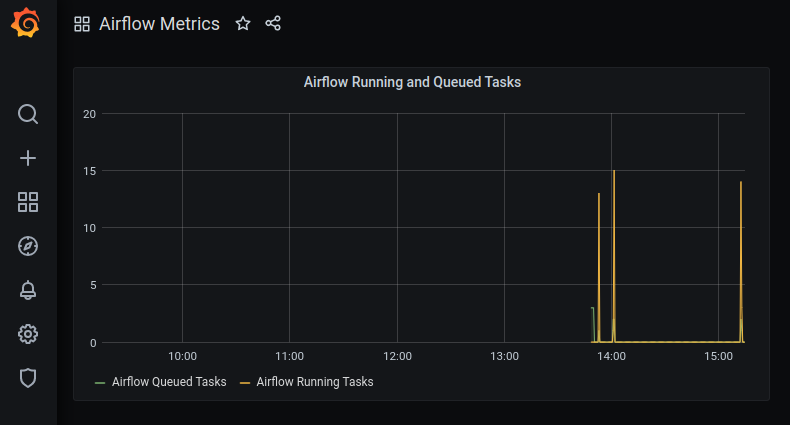
The current deployment leverages provisioning, which uses code to define datasources, dashboards, and notifiers in Grafana upon startup (more information here). The Prometheus datasource is already provisioned, as well as an Airflow Metrics dashboard tracking the number of running and queued tasks over time. The datasources, dashboards, and prometheus.yml configuration file are mounted as volumes on the container.
- Docker
- docker-compose
- Python3
- Git
The following steps are to be run in a terminal:
- Clone the repository:
git clone https://github.com/sarahmk125/airflow-docker-metrics.git - Navigate to the cloned folder:
cd airflow-docker-metrics - Startup the containers:
docker-compose -f docker-compose.yml up -d. (They can be stopped by running the same command except withstopat the end, ordownto remove them) - Note: a generic admin user is created when bringing up the containers. Username is
adminand password ispassword.
An Airflow Metrics dashboard has been provisioned in Grafana in this repository:
There are many more useful StatsD metrics made available, such as DAG and task duration. These can all be leveraged to create more dashboards.
The repository has been run locally, but can be deployed to any instance on GCP or AWS. SSHing onto the instance will allow the user to pull the repository, install the requirements, and start the Docker containers.
GCP Cloud Composer is a hosted Airflow deployment, however the configuration is not exposed. Capturing StatsD metrics may not be straight forward with that approach. This repository is a guide for a self-managed Airflow deployment; other hosted options for Airflow (such as Astronomer) exist.
The primary steps taken to transition from the puckel/docker-airflow to the apache/airflow image are:
- The
airflow initdbto initialize Airflow's backend database is run as a command when bringing up the webserver container, declared in thedocker-compose.ymlfile. - If using the CeleryExecutor, variables needed should be defined as ENV variables in the
docker-compose.ymlfile.
Ways to improve the current architecture include:
- Not running a
sleepcommand in the scheduler to wait for thedb initcommand in thewebserverto complete. - Bugfixes: sometimes DAGs don't update in the UI, and don't show any errors. Cause is unknown.
Have suggestions? I love talking about data stacks. Shoot me a message here.

