- Start a standalone in-memory H2 database using
StartDatabase.java. - Connect to the database:
- From IntelliJ Ultimate from application.properties file
- After starting the app, directly at http://localhost:8080/h2-console
using (url =
jdbc:h2:tcp://localhost/~/test, user=sa, password=sa)
Run StartDatabaseProxy.java to simulate a network delay in talking to a remote DB.
Run SecondApp.java to start a second application that will be called by the first one.
Glowroot is a lightweight Java Agent that collects performance metrics and traces.
Download it from glowroot.org.
Unzip the dist zip, and copy the path to the glowroot.jar in the root folder.
Add glowroot.jar to the 'VM option' field of your run configuration in IntelliJ:
-javaagent:/path/to/glowroot.jar.
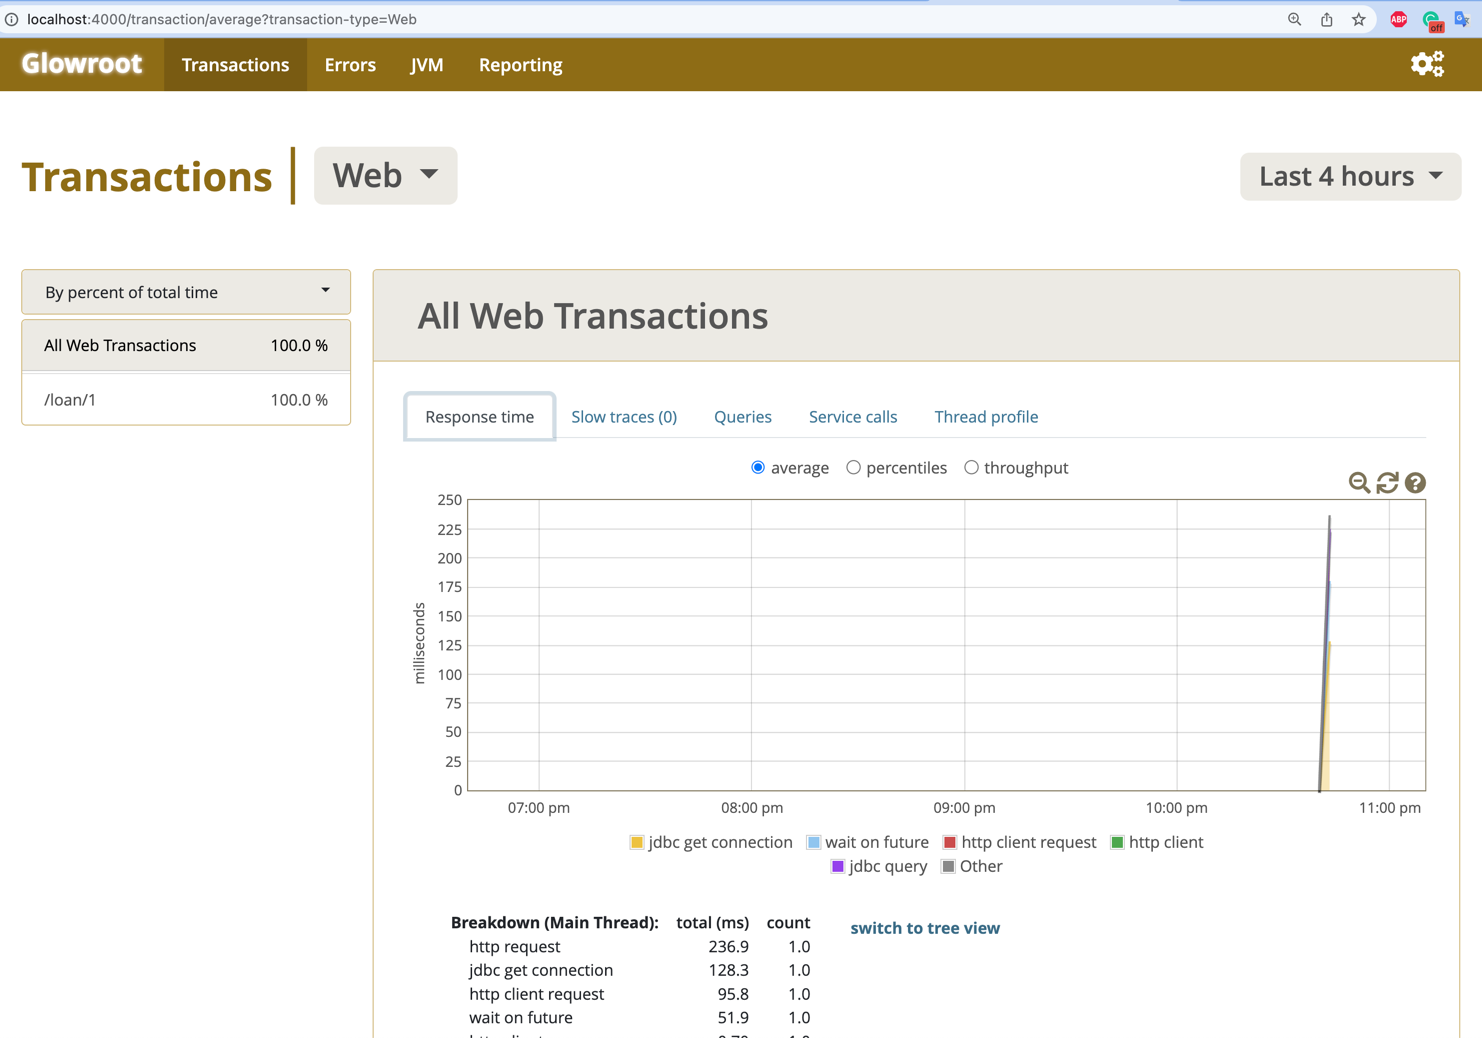
After starting the application, you can access the Glowroot UI at http://localhost:4000.
You should see a page like this:

- Start the monitoring-otel docker compose
- Download the OTEL agent from https://github.com/open-telemetry/opentelemetry-java-instrumentation/releases
- Add to your VM options:
-javaagent:/path/to/opentelemetry-javaagent.jar -Dotel.instrumentation.micrometer.enabled=true -Dotel.metric.export.interval=500 -Dotel.bsp.schedule.delay=500
Run ProfiledApp.java with the Glowroot agent.
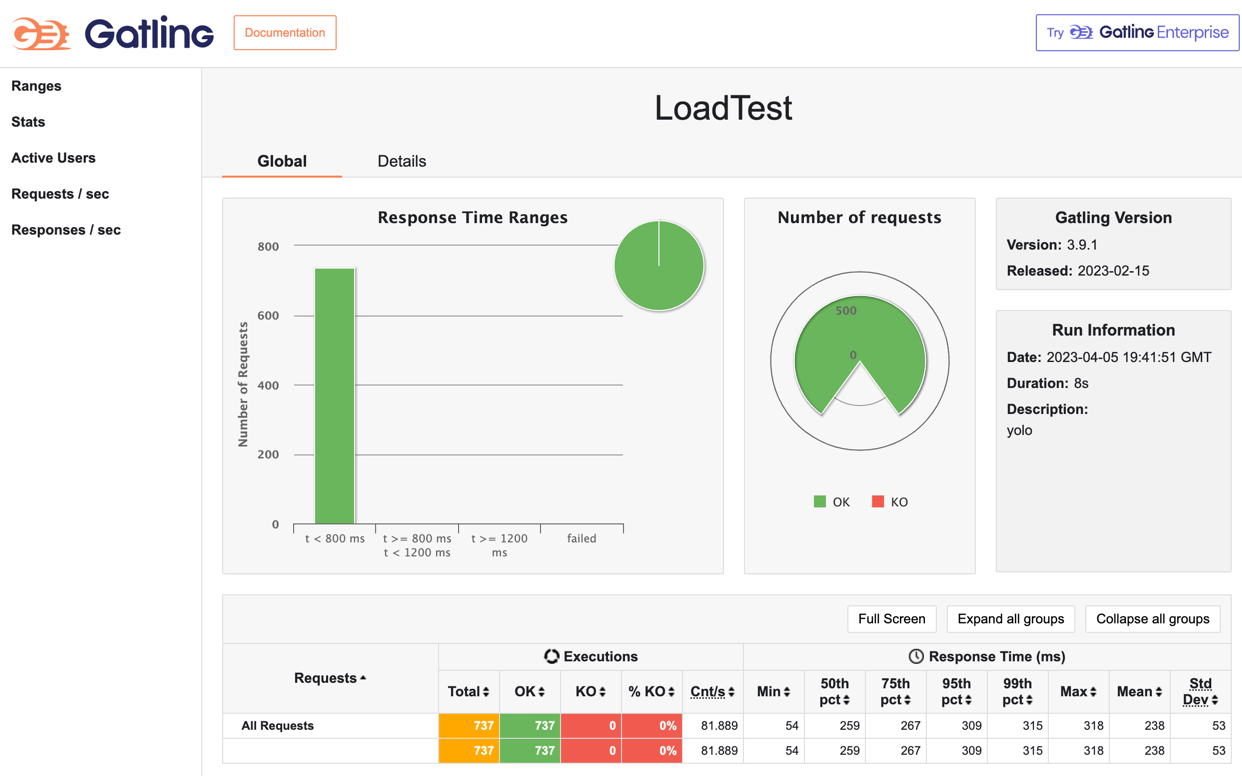
Run LoadTest.java and click the report printed in the console at the end.
If successful, the generated HTML report should display a green bar like this:

Note: We are using an artificial 'closed' load test model: (the number of users if fixed)
Go to http://localhost:4000/transaction/thread-flame-graph?transaction-type=Web
- Avoid useless network call from @Aspect
- restTemplate.getForObject sometimes does not have to run: reorder lines
- Observe: the time spent in the aspect is gone
- Fix JDBC Connection Starvation issue:
- Observe the Hikari getConnection time in the flamegraph
- [Optional] increase Hikari connection pool size -> starvation fixed; UNDO
- Make getLoanApplication not @Transactional -> no change :(
- Release the JDBC Connection earlier by
spring.jpa.open-in-view=false
- Lazy loading in toString
- Observe: LoanApplication.toString performs a lazy load
- Use log.trace("... {}", loanApplication) instead of log.trace("..." + loanApplication)
- Fix the lazy load by manually creating a toString that does not include the collection fields/@ToString.Exclude
- Fix the Apache HTTP Client connection pool
- Observe: time is spent to acquire a connection from the Apache Http connection pool
- Remove
feign.httpclient.max-connections-per-routefrom application.properties
Import https://grafana.com/grafana/dashboards/19004-spring-boot-statistics/