Explore the docs »
Report Issues
·
Read Blog
·
Get In Touch
·
About Us
💫 Check out VL Datasets release blog post


visuallayer SDK is an open-source Python package that offers access and extensibility to the Visual Layer platform from your code.
While the platform offers a high-level overview and visualization of your data, the SDK affords you the flexibility to integrate into your favorite machine learning frameworks and environments (e.g. Jupyter Notebook) using Python.
The easiest way to use the visuallayer SDK is to install it from PyPI. On your machine, run:
pip install visuallayerOptionally, you can also install the bleeding edge version on GitHub by running:
pip install git+https://github.com/visual-layer/visuallayer.git@main --upgradeThe visuallayer SDK also lets you access VL Datasets - a collection of clean versions of widely used computer vision datasets.
For example with only 2 lines of code, load the clean vl datasets version of the ImageNet-1k dataset with:
import visuallayer as vl
dataset = vl.datasets.zoo.load('vl-imagenet-1k')

#Export to PyTorch
train_dataset = dataset.export(output_format='pytorch', split='train')

#PyTorch training loopNote:
visuallayerdoes not automatically download the ImageNet dataset, you should make sure to obtain usage rights to the dataset and download it into your current working directory first.
When we say "clean" we mean that the datasets loaded by visuallayer SDK were flagged from common issues such as duplicates, mislabels, outliers,
dark/bright/
blurry and data leakage.
See full description for issues support in our documentation.
We provide a Dataset Zoo where you can find all information for each VL Dataset.
For each dataset in the zoo, we ran an analysis using VL Profiler and found issues pertaining to the original dataset. The following table is a detailed breakdown of the issues for each dataset.
| Dataset Name | Total Images | Total Issues (%) | Total Issues (Count) | Duplicates (%) | Duplicates (Count) | Outliers (%) | Outliers (Count) | Blur (%) | Blur (Count) | Dark (%) | Dark (Count) | Bright (%) | Bright (Count) | Mislabels (%) | Mislabels (Count) | Leakage (%) | Leakage (Count) |
|---|---|---|---|---|---|---|---|---|---|---|---|---|---|---|---|---|---|
| ImageNet-21K | 13,153,500 |
14.58% |
1,917,948 |
10.53% |
1,385,074 |
0.09% |
11,119 |
0.29% |
38,463 |
0.18% |
23,575 |
0.43% |
56,754 |
3.06% |
402,963 |
- |
- |
| ImageNet-1K | 1,431,167 |
1.31% |
17,492 |
0.57% |
7,522 |
0.09% |
1,199 |
0.19% |
2,478 |
0.24% |
3,174 |
0.06% |
770 |
0.11% |
1,480 |
0.07% |
869 |
| LAION-1B | 1,000,000,000 |
10.40% |
104,942,474 |
8.89% |
89,349,899 |
0.63% |
6,350,368 |
0.77% |
7,763,266 |
0.02% |
242,333 |
0.12% |
1,236,608 |
- |
- |
- |
- |
| KITTI | 12,919 |
18.32% |
2,748 |
15.29% |
2,294 |
0.01% |
2 |
- |
- |
- |
- |
- |
- |
- |
- |
3.01% |
452 |
| COCO | 330,000 |
0.31% |
508 |
0.12% |
201 |
0.09% |
143 |
0.03% |
47 |
0.05% |
76 |
0.01% |
21 |
- |
- |
0.01% |
20 |
| DeepFashion | 800,000 |
7.89% |
22,824 |
5.11% |
14,773 |
0.04% |
108 |
- |
- |
- |
- |
- |
- |
- |
- |
2.75% |
7,943 |
| CelebA-HQ | 30,000 |
2.36% |
4,786 |
1.67% |
3,389 |
0.08% |
157 |
0.51% |
1,037 |
0.00% |
2 |
0.01% |
13 |
- |
- |
0.09% |
188 |
| Places365 | 1,800,000 |
2.09% |
37,644 |
1.53% |
27,520 |
0.40% |
7,168 |
- |
- |
0.16% |
2,956 |
- |
- |
- |
- |
- |
- |
| Food-101 | 101,000 |
0.62% |
627 |
0.23% |
235 |
0.08% |
77 |
0.18% |
185 |
0.04% |
43 |
- |
- |
- |
- |
- |
- |
| Oxford-IIIT Pet | 7,349 |
1.48% |
132 |
1.01% |
75 |
0.10%
| 7 |
- |
- |
0.05% |
4 |
- |
- |
- |
- |
0.31% |
23 |
We provide here full details on each issues removed from a VL Dataset (a vl dataset card).
The clean version of a dataset is prefixed with vl- to differentiate it from the original dataset.
You can also freely download all found issues CSV.
| VL Dataset Card | Original Dataset | Explore | Issues CSV | Hugging Face Dataset |
|---|---|---|---|---|
| vl-imagenet-21k | ImageNet-21K |  |
 |
 |
| vl-imagenet-1k | ImageNet-1K |  |
 |
 |
| vl-laion-1b | LAION-1B |  |
 |
 |
| vl-kitti | KITTI |  |
 |
 |
| vl-coco | COCO |  |
 |
 |
| vl-deepfashion | DeepFashion |  |
 |
 |
| vl-celeba-hq | CelebA-HQ |  |
 |
 |
| vl-places365 | Places365 |  |
 |
 |
| vl-food-101 | Food-101 |  |
 |
 |
| vl-oxford-iiit-pet | Oxford-IIIT Pet |  |
 |
 |
We will continue to support more datasets. Here are a few currently in our roadmap:
- EuroSAT
- Flickr30k
- INaturalist
- SVHN
- Cityscapes
- RVL-CDIP
- DocLayNet
Let us know if you have additional request to support a specific dataset.
Note: If you'd like to use our cloud tool and discover issues with your own dataset, sign up to use our cloud platform for free.
The following sections show how to use the visuallayer SDK to load, inspect and export a VL Dataset.
We offer handy functions to load datasets from the Dataset Zoo. First, let's list the datasets in the zoo with:
import visuallayer as vl
vl.datasets.zoo.list_datasets()
which currently outputs:
['vl-oxford-iiit-pets',
 'vl-imagenet-21k',
 'vl-imagenet-1k',
 'vl-food101',
 'oxford-iiit-pets',
 'imagenet-21k',
 'imagenet-1k',
 'food101']
To load the dataset:
vl.datasets.zoo.load('vl-oxford-iiit-pets')This loads the clean version of the Oxford IIIT Pets dataset where all of the problematic images are excluded from the dataset.
To load the original Oxford IIIT Pets dataset, simply drop the vl- prefix:
original_pets_dataset = vl.datasets.zoo.load('oxford-iiit-pets')This loads the original dataset with no modifications.
Now that you have a dataset loaded, you can view information pertaining to that dataset with:
my_pets.infoThis prints out high-level information about the original Dataset. In this example, we used the Pets Dataset from Oxford.
Metadata:
--> Name - vl-oxford-iiit-pets
--> Description - A modified version of the original Oxford IIIT Pets Dataset removing dataset issues.
--> License - Creative Commons Attribution-ShareAlike 4.0 International (CC BY-SA 4.0)
--> Homepage URL - https://www.robots.ox.ac.uk/~vgg/data/pets/
--> Number of Images - 7349
--> Number of Images with Issues - 109
If you'd like to view the issues related to the dataset, run:
my_pets.reportwhich outputs:
| Reason    | Count | Pct   |
|-----------|-------|-------|
| Duplicate | 75    | 1.016 |
| Outlier   | 7     | 0.095 |
| Dark      | 4     | 0.054 |
| Leakage   | 23    | 0.627 |
| Total     | 109   | 1.792 |
Now that you've seen the issues with the dataset, you can visualize them on screen. There are two options to visualize the dataset issues.
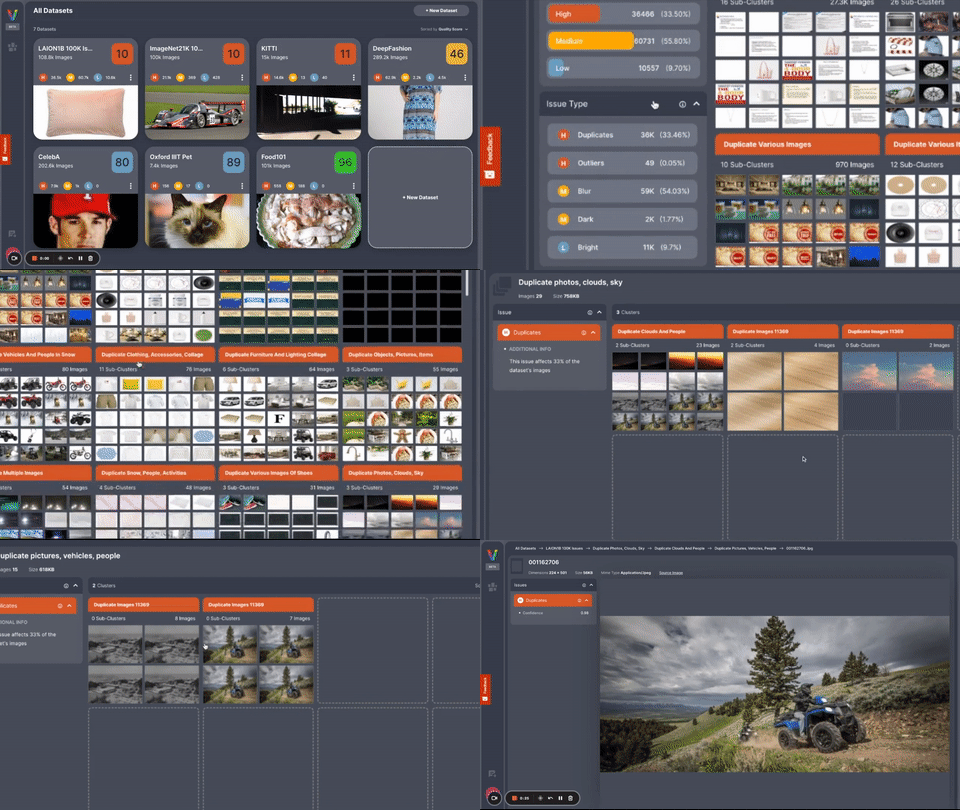
Option 1 - Using the Visual Layer Profiler (VL Profiler) - Provides an extensive capability to view, group, sort, and filter the dataset issues. Sign-up for free.
Here's the visualization using the VL Profiler:
Option 2 - In Jupyter Notebook - Provides a limited but convenient way to view the dataset without leaving your notebook.
To visualize the issues using Option 2 in your notebook, run:
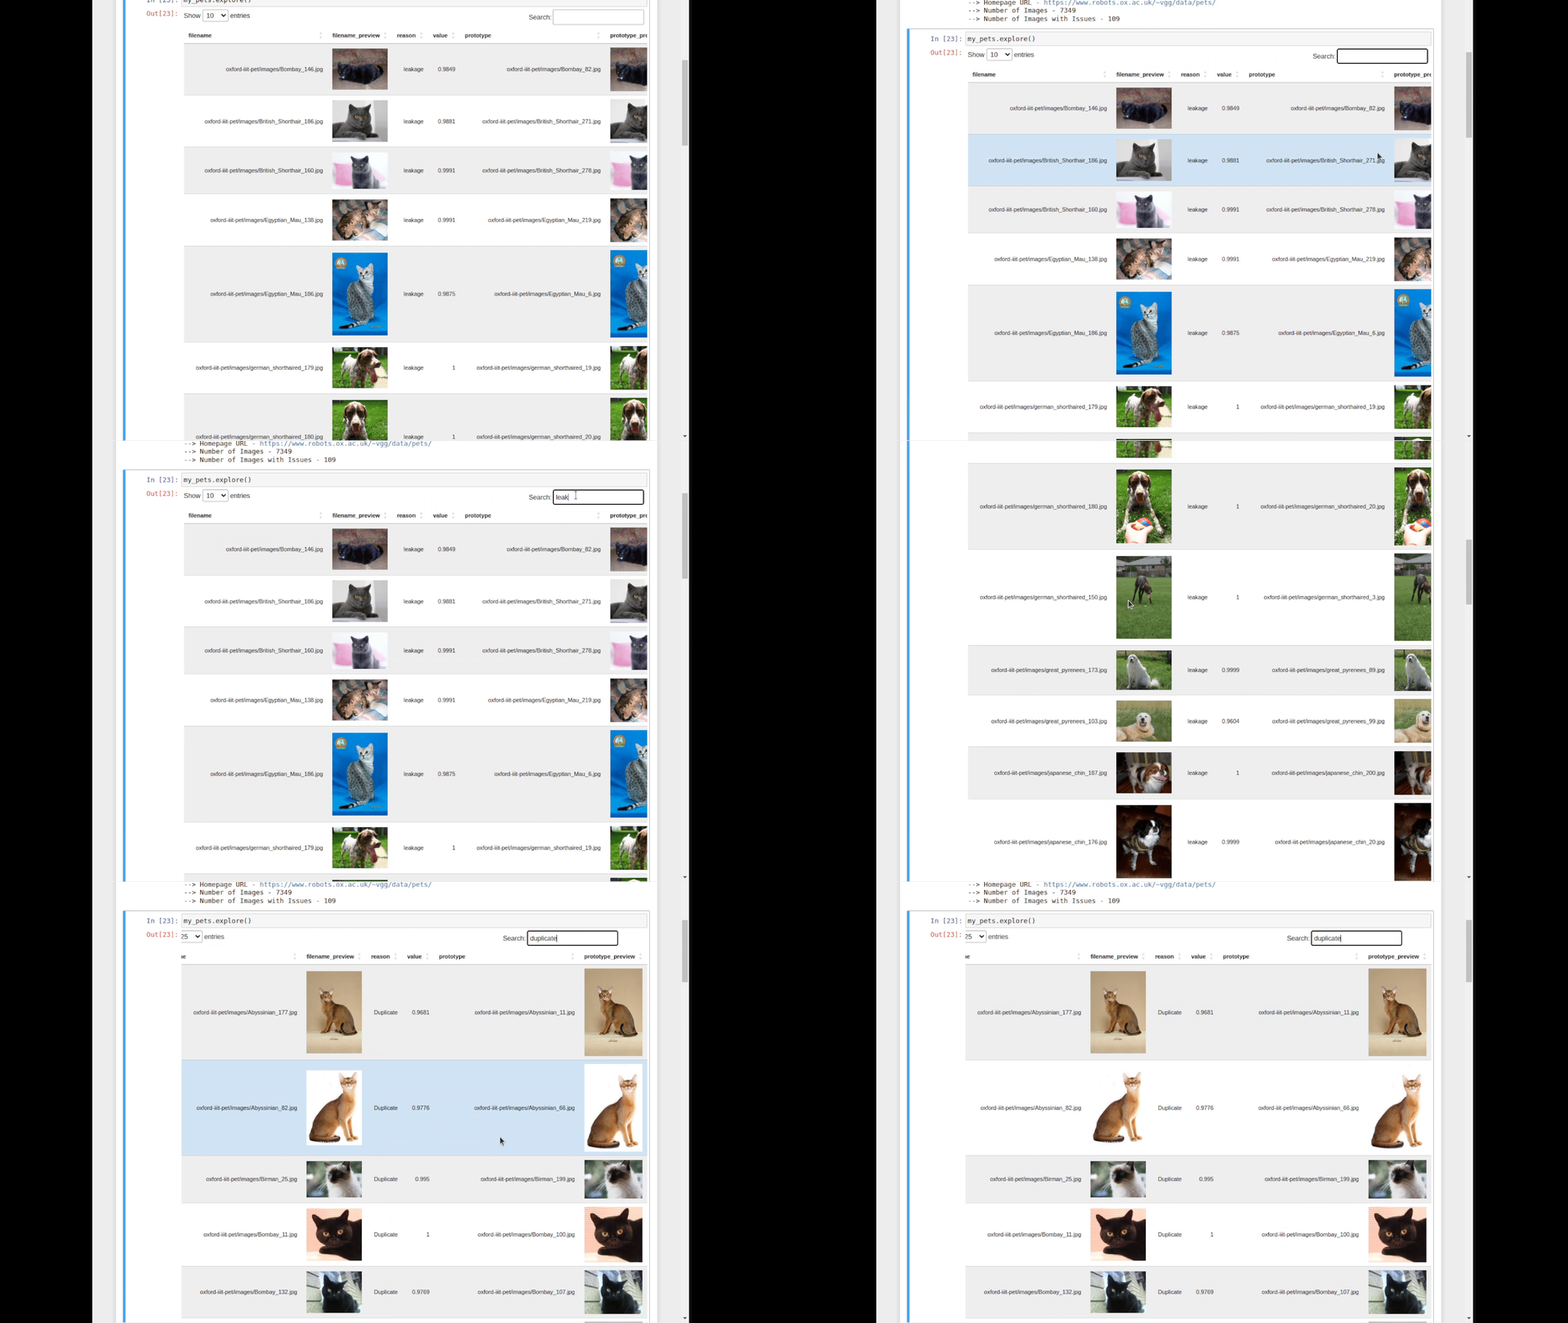
my_pets.explore()This should output an interactive table in your Jupyter Notebook like the following.
In the interactive table, you can view the issues, sort, filter, search, and compare the images side by side.
By default, the .explore() load the top 50 issues from the dataset covering all issue types. If you'd like a more granular control, you can change the num_images and issue arguments.
For example:
pets_dataset.explore(num_images=100, issue='Duplicate')The interactive table provides a convenient but limited way to visualize dataset issues. For a more extensive visualization, view the issues using the Visual Layer Profiler.
Check out the documentation and blog page for the Visual Layer Profiler for more info.
If you'd like to use a loaded dataset to train a model, you can conveniently export the dataset with:
test_dataset = my_pets.export(output_format="pytorch", split="test")This exports the Dataset into a Pytorch Dataset object that can be used readily with a PyTorch training loop.
Alternatively, you can export the Dataset to a DataFrame with:
test_dataset = pets_dataset.export(output_format="csv", split="test")In this section, we show an end-to-end example of how to load, inspect and export a dataset and then train using PyTorch and fastai framework.
visuallayer SDK is licensed under the Apache 2.0 License. See LICENSE.
However, you are bound to the usage license of the original dataset. It is your responsibility to determine whether you have permission to use the dataset under the dataset's license. We provide no warranty or guarantee of accuracy or completeness.
Usage Tracking
This repository incorporates usage tracking using Sentry.io to monitor and collect valuable information about the usage of the application.
Usage tracking allows us to gain insights into how the application is being used in real-world scenarios. It provides us with valuable information that helps in understanding user behavior, identifying potential issues, and making informed decisions to improve the application.
We DO NOT collect folder names, user names, image names, image content, and other personally identifiable information.
What data is tracked?
- Errors and Exceptions: Sentry captures errors and exceptions that occur in the application, providing detailed stack traces and relevant information to help diagnose and fix issues.
- Performance Metrics: Sentry collects performance metrics, such as response times, latency, and resource usage, enabling us to monitor and optimize the application's performance.
To opt-out, define an environment variable named SENTRY_OPT_OUT.
On Linux/macOS, run the following:
export SENTRY_OPT_OUT=TrueRead more on Sentry's official webpage.
Get help from the Visual Layer team or community members via the following channels -
Visual Layer is founded by the authors of XGBoost, Apache TVM & Turi Create - Danny Bickson, Carlos Guestrin and Amir Alush.
Learn more about Visual Layer here.


