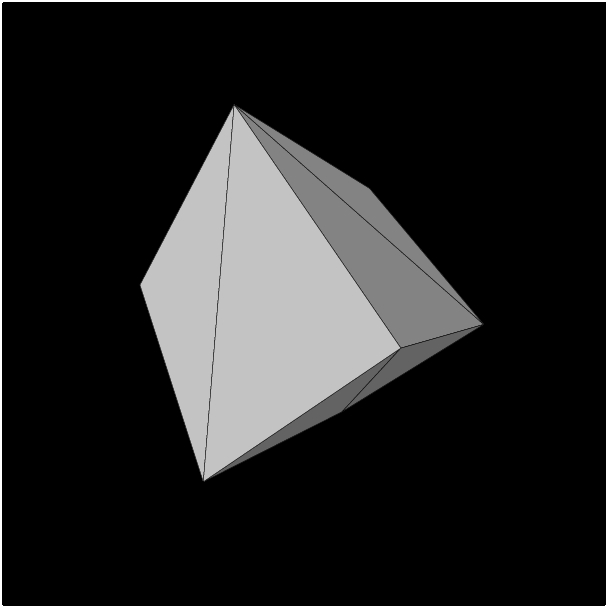
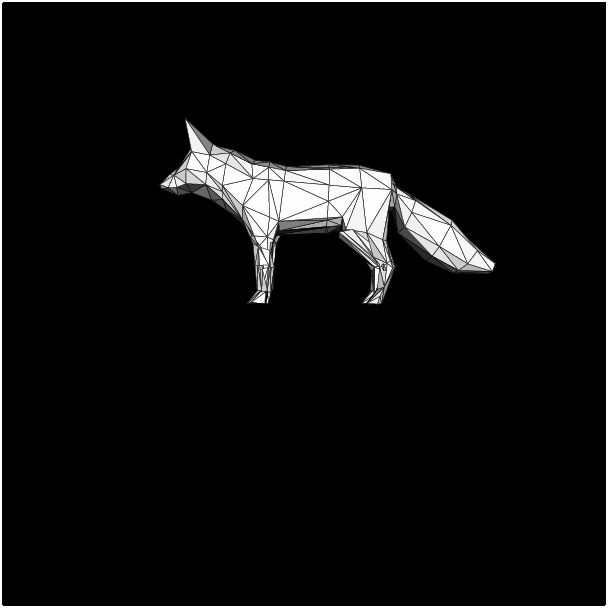
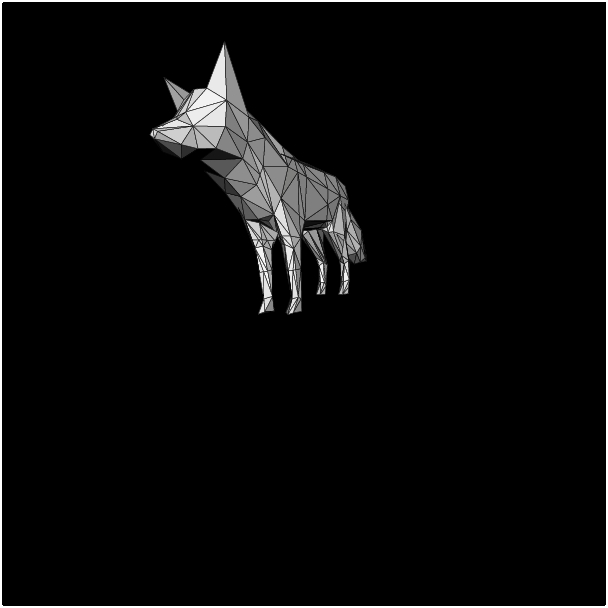
Roughly converts obj files to jgraph outputs.
The program takes a .obj 3D object file on standard input and outputs jgraph file data on standard output.
It takes 3 command line arguments: x rotation, y rotation, and 'zoom'. Tweak these values to get the model into a better looking position.
Textures aren't supported, but most obj files should render in some capacity. If the entire screen is black (or white) consider changing the zoom to be much larger or much smaller. Some models have a total width of ~1, others have a width of 10,000. My program doesn't automatically adjust for that, so you have to manually do so by zooming.
After parsing the .obj file, you're left with a Mesh (vector of triangles) where each triangles is an array of 3 vertices, where each vertex is a struct of 4 floats. Mesh contains Triangles contain vertices which contain x/y/z coordinates.
With the mesh loaded in, it's as simple as iterating through that vector of triangles and performing a series of linear transformations on each triangle. The core transformation is to multiply each triangle by the "projection matrix" which looks like this:
 [  AspectRatio*FOV         0                       0                       0
    0                       FOV                     0                       0
    0                       0                       Far/(Far-Near)          1
    0                       0                       (-Far*Near)/(Far-Near)  0  ]
The gist of this is that we need to account for the fact that human vision is conal rather than orthoganal, so X and Y values are multiplied by this FOV factor (1/tan(theta/2)) which allows objects/triangles in the distance to span less of your field of vision than objects/triangles right in front of your view. The Z coordinate also needs to be multiplied by this Far/(Far-Near) factor in order to determine its distance from the camera origin (along z) so that the order of drawing can be determined later. Finally, the matrix is expanded to be 4x4 so we can extract z coordinate data later for culling.
In addition to this main projection matrix, I used rotation matrices and a translation matrix to move/rotate the object around the viewport. Simply multiply triangles by these other matrices before the final projection.
Up until this point, we're just drawing wireframe triangles. To give the model the appearance of solidity, first do a calculation to determine which triangles should be visible from the camera and cull those that aren't. Then, for each triangle, calculate the dot product of the triangle normal with a chosen light source (in this case {0, 0, -1}) and set the grayscale fill of the triangle to that dot product. Triangles that are directly facing the light source will be white, triangles facing directly perpendicular to the light source will be black, and triangles facing away from the camera will not be drawn.
Finally, just output these translated/projected triangle's coordinates to standard output in the .jgr file format. The prototype for that:
newline poly linethickness 0 gray 0 pfill <dot-product> pts <x,y for vertex 1> <x,y for vertex 2> <x,y for vertex 3>
./obj2jgr 45 45 3 < cube.obj > cube.jgr
./jgraph cube.jgr | convert -density 300 - -quality 100 graphs/output.jpg

./obj2jgr 0 90 140 < fox.obj > fox.jgr
./jgraph fox.jgr | convert -density 300 - -quality 100 graphs/output.jpg

./obj2jgr 25 150 120 < fox.obj > fox.jgr
./jgraph fox.jgr | convert -density 300 - -quality 100 graphs/output.jpg

./obj2jgr 0 90 140 < fox.obj > fox.jgr
As of now the program is pretty limited in what it can display. To finish it up, I'd like to give it much more customizability on the user end. I'd like the user to be able to specify the position of the model in 3d space along with more rotation options, colors, etc.
It would be completely possible right now to write a shell script or something that just outputs .jgr files for every degree of x rotation from 0 to 360. If you stitched these together into a .gif, you'd have a nice spinning animation
Absolutely instrumental in this (ESPECIALLY the lighting/culling!) was the matrix projection/translation code from this series of youtube tutorials found here: https://www.youtube.com/watch?v=XgMWc6LumG4. This is an excellent series that goes into depth about the math behind 3D projections.