###What's new?
The 2016 SODA competition just started from July 12. The metro data is provided again. You're welcome to join. See more information here: Shanghai 2016 SODA
###What's this project?
This is a data visualization project based on the public transportation data (mostly metro data) released by Shanghai government in 2015. With this project, I and my friends participated in the 2015 SODA (Shanghai Open Data Application) competition and won a little prize.
###What the visualization is about?
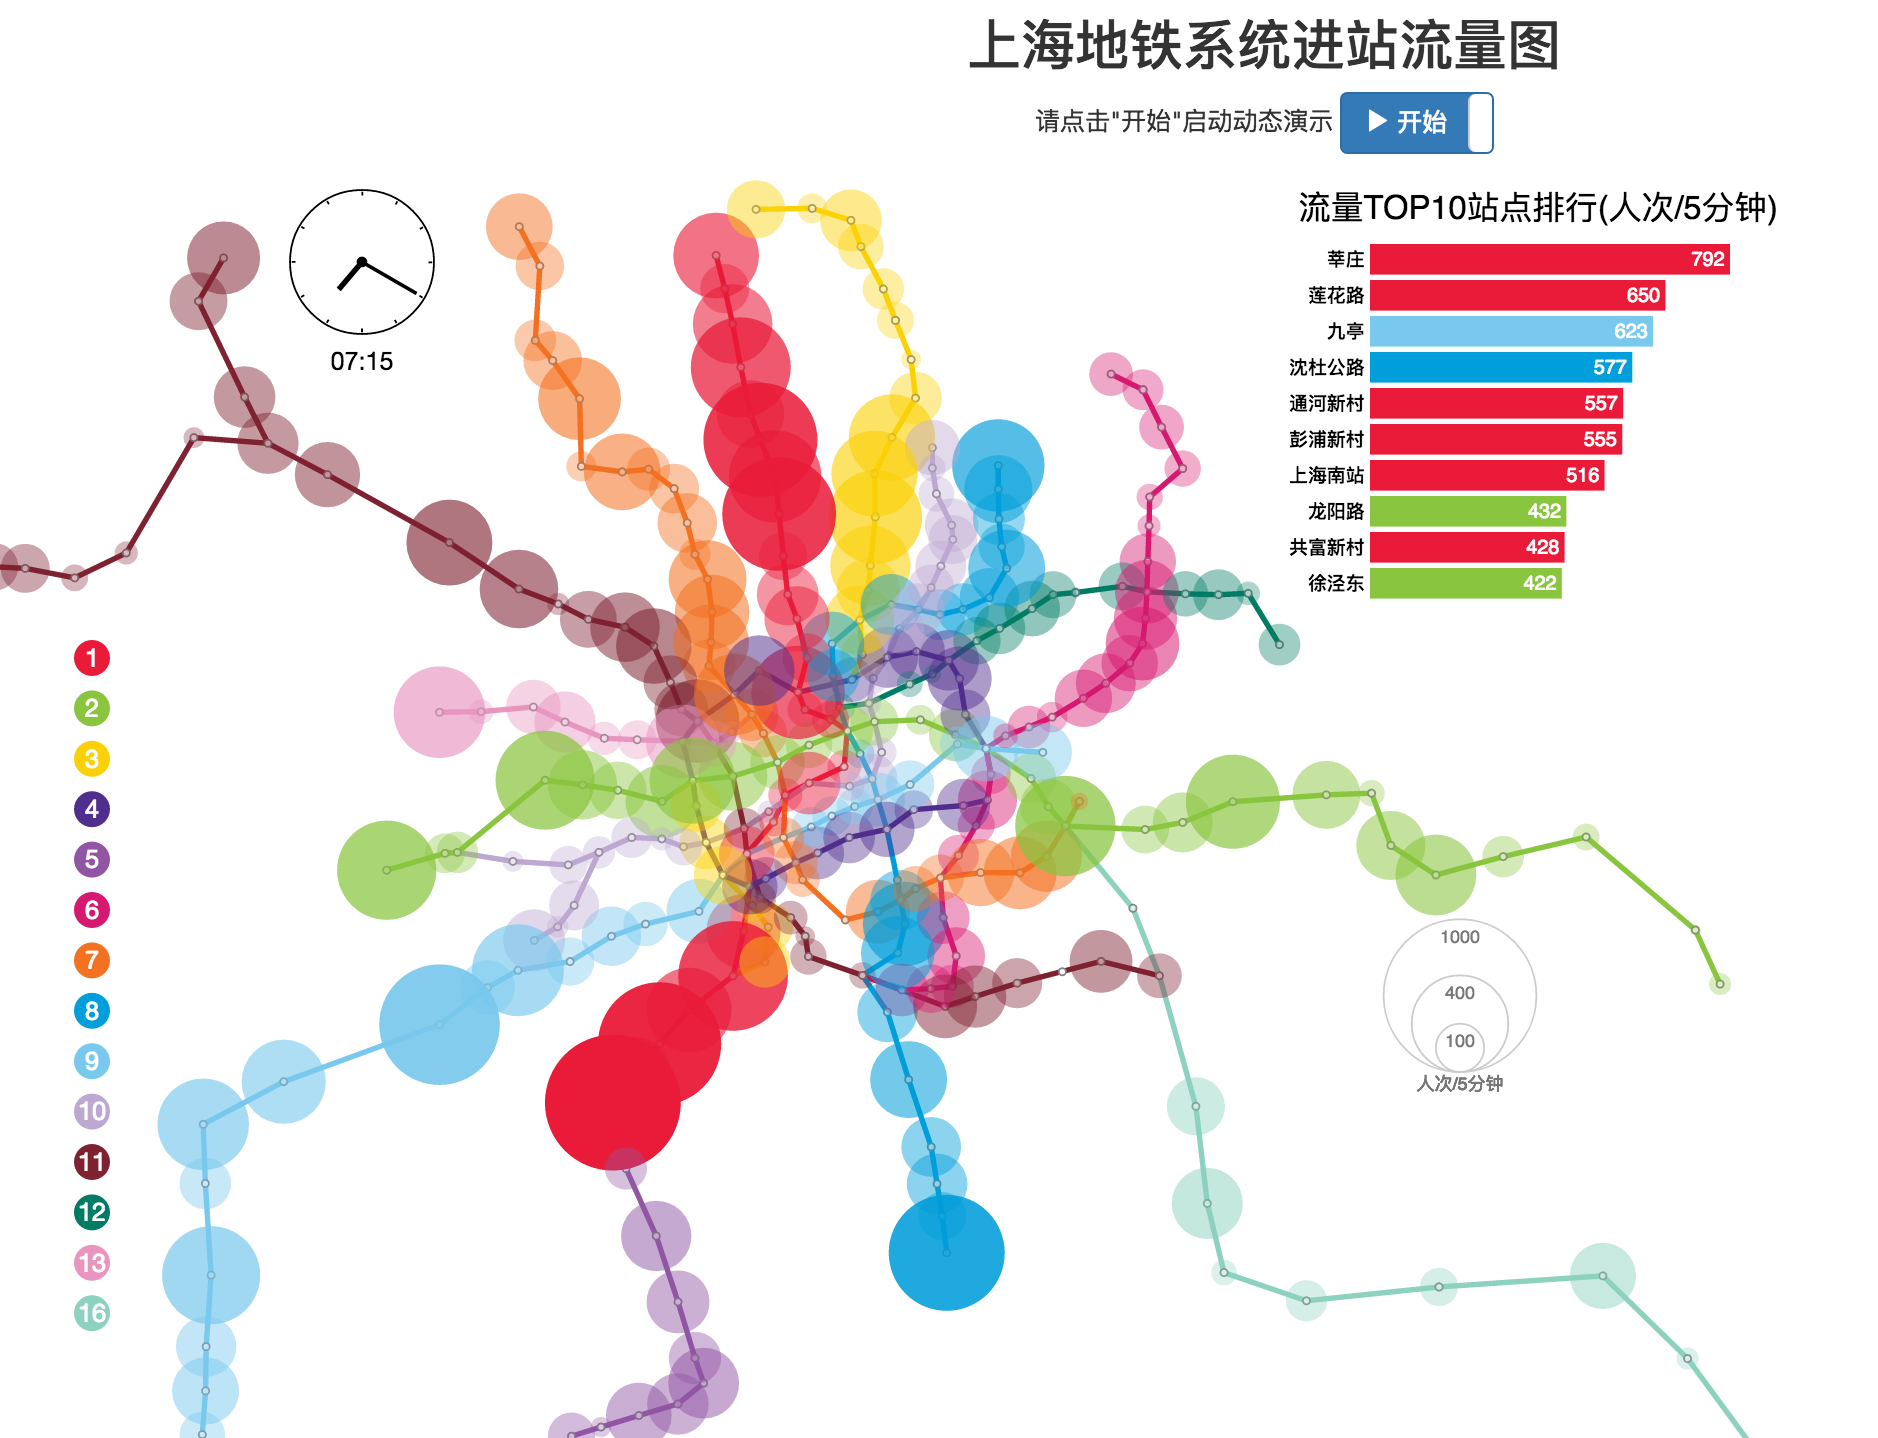
As a daily metro commuter, I am really interested in knowing how many people are flowing in and out of the metro system at each station. So I created this project just to answer that.
###Give me an example of the visualization.
Check this out. If you clone this project, you can also see some animations.
###How to see the visualiation?
Follow the following steps, you will see the visualization on your computer as well:
- Clone this repo
- CD into the directory of the repo
- Run a local server on this directory. In my case, I run a local server by typing in "python -m SimpleHTTPServer 8888"
- Open your browser and go to localhost:8888
- Click some HTML file links
###What are the tools used for this project?
The visualization is built with d3 library. The data are handled by some python scripts while queries are done with SQLServer (not included here).
