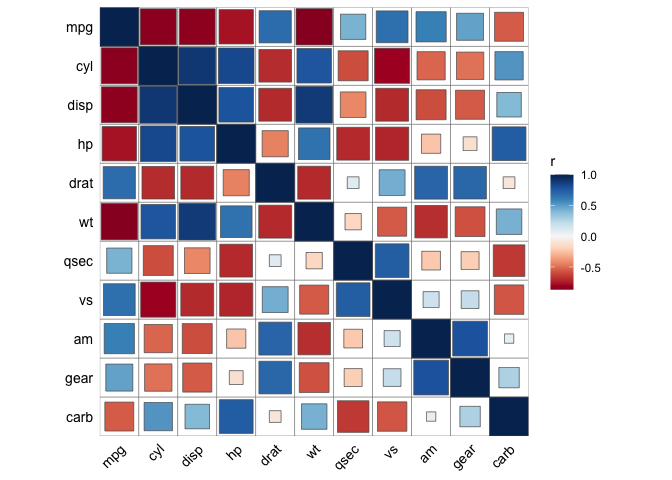
The goal of ggcor is to provide a set of functions that can be used to
visualize a correlation matrix quickly.
Now ggcor is not on cran, You can install the development version of
ggcor from GitHub with:
# install.packages("devtools")
devtools::install_github("houyunhuang/ggcor")library(ggplot2)
library(ggcor)
set_scale()
quickcor(mtcars) + geom_square()quickcor(mtcars, type = "upper") + geom_circle2()quickcor(mtcars, cor.test = TRUE) +
geom_square(data = get_data(type = "lower", show.diag = FALSE)) +
geom_mark(data = get_data(type = "upper", show.diag = FALSE), size = 2.5) +
geom_abline(slope = -1, intercept = 12)library(dplyr)
#> Warning: package 'dplyr' was built under R version 3.6.2
data("varechem", package = "vegan")
data("varespec", package = "vegan")
mantel <- mantel_test(varespec, varechem,
spec.select = list(Spec01 = 1:7,
Spec02 = 8:18,
Spec03 = 19:37,
Spec04 = 38:44)) %>%
mutate(rd = cut(r, breaks = c(-Inf, 0.2, 0.4, Inf),
labels = c("< 0.2", "0.2 - 0.4", ">= 0.4")),
pd = cut(p.value, breaks = c(-Inf, 0.01, 0.05, Inf),
labels = c("< 0.01", "0.01 - 0.05", ">= 0.05")))
quickcor(varechem, type = "upper") +
geom_square() +
anno_link(aes(colour = pd, size = rd), data = mantel) +
scale_size_manual(values = c(0.5, 1, 2)) +
scale_colour_manual(values = c("#D95F02", "#1B9E77", "#A2A2A288")) +
guides(size = guide_legend(title = "Mantel's r",
override.aes = list(colour = "grey35"),
order = 2),
colour = guide_legend(title = "Mantel's p",
override.aes = list(size = 3),
order = 1),
fill = guide_colorbar(title = "Pearson's r", order = 3))rand_correlate(100, 8) %>% ## require ambient packages
quickcor(circular = TRUE, cluster = TRUE, open = 45) +
geom_colour(colour = "white", size = 0.125) +
anno_row_tree() +
anno_col_tree() +
set_p_xaxis() +
set_p_yaxis()
#> Warning: Removed 8 rows containing missing values (geom_text).d1 <- rand_dataset(20, 30) %>%
gcor_tbl(cluster = TRUE)
p <- matrix(sample(LETTERS[1:4], 90, replace = TRUE), nrow = 30,
dimnames = list(paste0("sample", 1:30), paste0("Type", 1:3))) %>%
gcor_tbl(name = "Type", row.order = d1) %>%
qheatmap(aes(fill = Type)) + coord_fixed() + remove_y_axis()
d2 <- data.frame(x = sample(paste0("var", 1:20), 200, replace = TRUE))
set_scale()
quickcor(d1) +
geom_colour(aes(fill = value)) +
anno_hc_bar(width = 1) +
anno_row_custom(p) +
anno_row_tree() +
anno_hc_bar(pos = "top") +
anno_bar(d2, aes(x = x), height = 0.12) +
anno_col_tree(height = 0.12)To cite the ggcor package in publications
use:
Houyun Huang, Lei Zhou, Jian Chen and Taiyun Wei(2020). ggcor: Extended tools for correlation analysis and visualization. R package version 0.9.7.
A BibTeX entry for LaTeX users is
  @Manual{
    entry  = "manual",
    title  = {ggcor: Extended tools for correlation analysis and visualization},
    author = {Houyun Huang, Lei Zhou, Jian Chen and Taiyun Wei},
    year   = {2020},
    note   = {R package version 0.9.7},
    url    = {https://github.com/houyunhuang/ggcor},
  }
The above citation information can be generated by calling
citation("ggcor") in R.


