Kabaya1981
Data contributor: Masae I. Ishihara, Hajime Utsugi, Hiroyuki Tanouchi, Tsutom Hiura
Email: [email protected]
Address:
- Graduate School for International Development and Cooperation, Hiroshima University, 1-5-1 Kagamiyama, Higashi-Hiroshima 739-8529, Japan
- Forestry and Forest Products Research Institute (FFPRI), 1 Matsunosato, Tsukuba, Ibaraki, 305-8687, Japan
- Hokkaido Research Center, Forestry and Forest Products Research Institute (FFPRI), Hitsujigaoka-7, Toyohira, Sapporo, Hokkaido, 062-8516, Japan
- Tomakomai Research Station, Field Science Center for Northern Biosphere, Hokkaido University, Takaoka, Tomakomai 053-0035, Japan
Citation: Kabaya H (1981). 'Causal analyses of poor growth observed at the inner part of the pine plantations on costal sand dune.' Bulletin of the Tokyo University Forests, 70, pp. 11-80.
DOI:
Abstract:
The dataset includes records for 40 individuals from 1 species belonging to 1 family(ies), presenting 1 functional type(s), growing in 2 condition(s) within 1 major type(s) of habitat, with data included for the following variables:
| Variable | Label | Units | N | Min | Median | Max |
|---|---|---|---|---|---|---|
| latitude | Latitude | deg | 40 | 35 | 35 | 36 |
| longitude | Longitude | deg | 40 | 138 | 138 | 140 |
| age | Age | yr | 40 | 20 | 34 | 34 |
| a.stba | Stem area at base | m2 | 12 | 0.00053 | 0.001 | 0.0027 |
| a.stbh | Stem area at breast height | m2 | 28 | 0.002 | 0.0057 | 0.046 |
| h.t | Height | m | 40 | 0.79 | 5.9 | 17 |
| d.ba | Basal diameter | m | 12 | 0.026 | 0.036 | 0.059 |
| d.bh | Dbh | m | 28 | 0.05 | 0.085 | 0.24 |
| h.bh | Height of d.bh measurement | m | 40 | 1.3 | 1.3 | 1.3 |
| m.lf | Leaf mass | kg | 40 | 0.15 | 1.4 | 12 |
| m.st | Total stem mass | kg | 40 | 0.29 | 11 | 195 |
| m.so | Aboveground mass | kg | 40 | 0.45 | 13 | 206 |
| m.br | Branch mass | kg | 40 | 0.23 | 2.1 | 28 |
| m.rt | Total root mass | kg | 21 | 0.15 | 2 | 12 |
| m.to | Total mass | kg | 21 | 0.77 | 9.5 | 48 |

And locally within the country:

## Error - location lies outside country borders. Perhaps add more decimal places?
The sites sampled are:
| Location | Longitude | Latitude | Vegetation |
|---|---|---|---|
| Japan-Arai Experimental Station of Tokyo University-CotrolC1 | 137.570 | 34.680 | Temperate forest |
| Japan-Arai Experimental Station of Tokyo University-Fertilized F1 since 1967 | 137.570 | 34.680 | Temperate forest |
| Japan-Arai Experimental Station of Tokyo University-Fertilized F2 since 1967 | 137.570 | 34.680 | Temperate forest |
| Japan-Arai Experimental Station of Tokyo University-Control C2 | 137.570 | 34.680 | Temperate forest |
| Japan-Arai Experimental Station of Tokyo University-Litter removal since 1967 | 137.570 | 34.680 | Temperate forest |
| Japan-Futtsu sea coast-Fertilized (NKP) in 1966-1968 | 139.800 | 35.310 | Temperate forest |
| Japan-Futtsu sea coast-Control (C2) | 139.800 | 35.310 | Temperate forest |
| Japan-Tanashi Experimental Field, Tokyo University- | 139.538 | 35.739 | Temperate forest |
| Japan-Chiba Forest of Tokyo University, Kiyosumi- | 140.100 | 35.200 | Temperate forest |
The growing conditions of sampled plants was:
| Location | growingCondition |
|---|---|
| Japan-Arai Experimental Station of Tokyo University-CotrolC1 | plantation managed, field wild |
| Japan-Arai Experimental Station of Tokyo University-Fertilized F1 since 1967 | plantation managed, field wild |
| Japan-Arai Experimental Station of Tokyo University-Fertilized F2 since 1967 | plantation managed, field wild |
| Japan-Arai Experimental Station of Tokyo University-Control C2 | plantation managed, field wild |
| Japan-Arai Experimental Station of Tokyo University-Litter removal since 1967 | plantation managed, field wild |
| Japan-Futtsu sea coast-Fertilized (NKP) in 1966-1968 | plantation managed, field wild |
| Japan-Futtsu sea coast-Control (C2) | plantation managed, field wild |
| Japan-Tanashi Experimental Field, Tokyo University- | plantation managed, field wild |
| Japan-Chiba Forest of Tokyo University, Kiyosumi- | plantation managed, field wild |
| Species | Family | Pft |
|---|---|---|
| Pinus thunbergii | Pinaceae | evergreen gymnosperm |
Sampling strategy: Harvest in Arai Experimental station was conducted in November 1969 at 5 Pinus thunbergii plantation plots (Kabaya 1981). Two plots were fertilized (F1 and F2) in 1967 with ammonium sulfate (250 kg/ha as N amount) and saw dust compost and in 1968, 1969, 1970 by ammonium sulfate (50 kg/ha as N amount). Two plots were control (C1 and C2). Litter was removed from one plot (R1) four times a year since 1967. All plots were 33-34 years old in 1967. Harvest in Futtsu sea coast was conducted in December 1968 at one fertilized (NKP) and one control (C2) plots. Both plots were planted with P. thunbergii in 1952 and 18 years old in 1966. Fertilized plot (NKP) was fertilized with ammonium nitrate, ammonium phosphate, and potassium chloride (1 kg/a as N, 1.2kg/a as P2O5, and 3 kg/a as K) in 1966. Additionally, this plot was fertilized with ammonium phosphate (1 kg/a as N) in 1967 and 1968. Harvest in a 33 year-old P. thunbergii plantation plot in Tanashi Experimental Field was conducted in October 1968. Harvest in a 22-23 year-old plot in a naturally regenerated P. thunbergii stand of Chiba Forest of Tokyo University was conducted in November 1968. The plot was facing southwest with a slope of 35-36 degrees. Two to five sample trees were felled from each plot. Sample trees were then treated with the stratified clip technique by cutting them into parts contained in horizontal layers of 2 m depth. Roots in a 1-m radius from the stump of a sampled tree were excavated.
Height: Methods not reported in Kabaya (1981).
Biomass: Fresh weight of stem, branches, and needles in each layer were measured. Branches and needles were further separated based on their ages (current-year, one year, second year, and others). Subsamples of each organ were taken and oven-dried at 80 degrees C (Kabaya 1981). The dry-to-fresh weight ratios of these subsamples were used to calculate total dry weight of each tree component.
Other variables: M.I. Ishihara, H. Utsugi, H. Tanouchi, and T. Hiura conducted formal search of reference databases and digitized raw data from Kabaya (1981). Based on this reference, meta data was also created by M.I. Ishihara. Species name and family names were converted by M.I. Ishihara according to the following references: Satake Y, Hara H (1989a) Wild flower of Japan Woody plants I (in Japanese). Heibonsha, Tokyo; Satake Y, Hara H (1989b) Wild flower of Japan Woody plants II (in Japanese). Heibonsha, Tokyo.
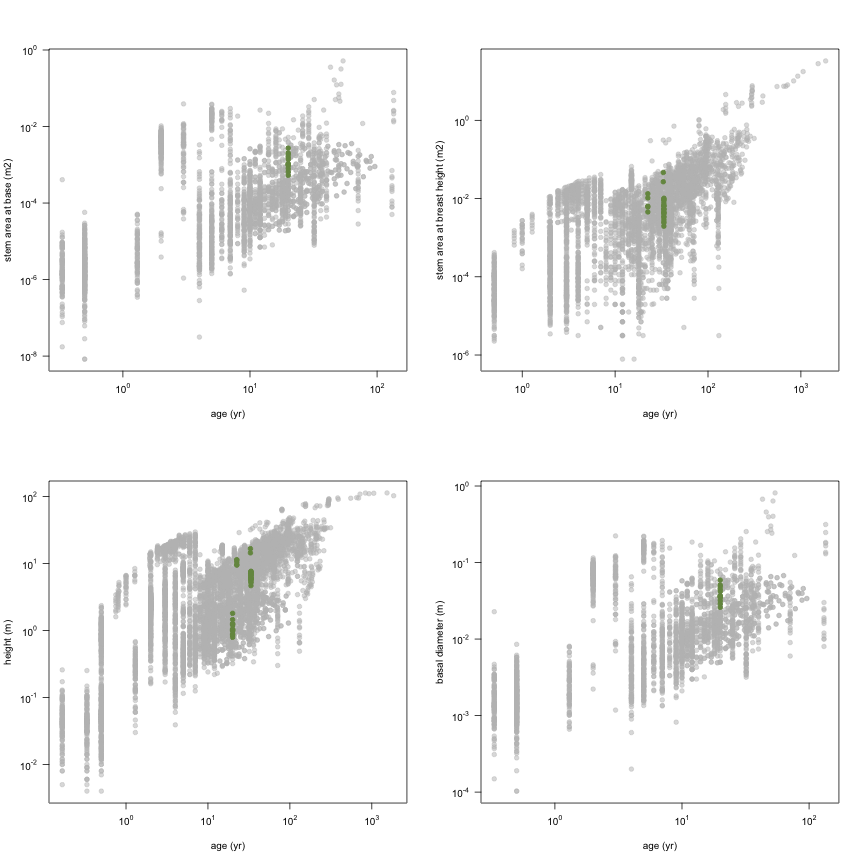
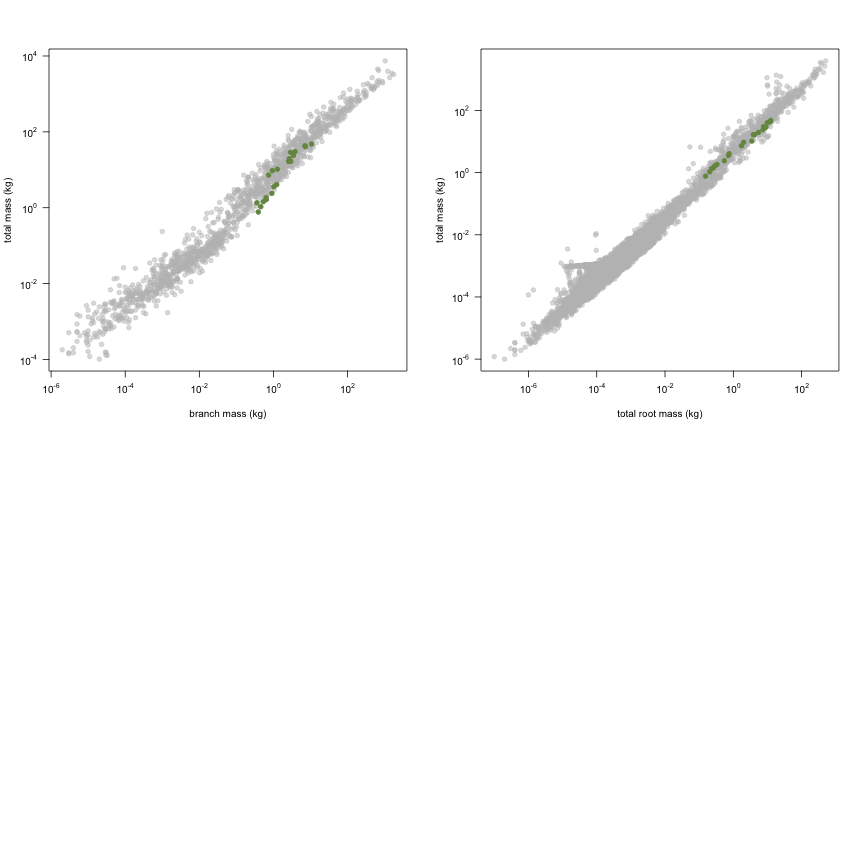
This is how the study Kabaya1981 fits in the entire dataset (grey). each colour represents a species. A legend of species names with colours is included at the end for reports with 1 < n < 20 species.