Mori1991
Data contributor: Shigeta Mori
Email: [email protected]
Address:
- Yamagata Univeristy, Wakaba-machi 1-23, Tusruoka-shi, Yamagata-ken, 997-8555, Japan
Citation: Mori S and Hagihara A (1991). 'Crown profile of foliage area characterized with the Weibull distribution in a hinoki (Chamaecyparis obtusa) stand.' Trees - Structure and Function, 5(3), pp. 149-152.
DOI: 10.1007/BF00204336
Abstract: Thirten sample trees of various sizes in a 29-year-old hinoki [ Chamaecyparis obtusa (Sieb, et Zucc.) Endl.] plantation were felled and subjected to the stratified clip technique. Crown profile of foliage area fitted well with the Weibull distribution. The crown profile tended to be more skewed toward the top of crowns in smaller trees than in larger trees. This tendency was reflected in the value of the shape parameter of the Weibull distribution. The shape parameter ranged from 1.73 to 3.23 and gradually increased up to an asymptotic value with an increase of stem diameter at breast height. The scale parameter of the distribution ranged from 1.0 to 4.2 and tended to increase in proportion to stem diameter at breast height. Foliage area of a tree correlated well with stem diameter at breast height through an ordinary allometric equation. Tree height could be approximated fairly well by a generalized allometric equation as a function of stem diameter at breast height. On the basis of the census of stem diameter at breast height, canopy profile could be constructed synthesizing crown profiles of foliage area for individual trees in the stand. Leaf area index was estimated to be 6.6 ha ha -1 .
The dataset includes records for 14 individuals from 1 species belonging to 1 family(ies), presenting 1 functional type(s), growing in 1 condition(s) within 1 major type(s) of habitat, with data included for the following variables:
| Variable | Label | Units | N | Min | Median | Max |
|---|---|---|---|---|---|---|
| latitude | Latitude | deg | 14 | 35 | 35 | 35 |
| longitude | Longitude | deg | 14 | 137 | 137 | 137 |
| a.lf | Leaf area | m2 | 14 | 0.57 | 6.1 | 24 |
| a.stbh | Stem area at breast height | m2 | 14 | 0.00096 | 0.0041 | 0.016 |
| a.cp | Crown area | m2 | 12 | 1.4 | 3.7 | 11 |
| h.t | Height | m | 14 | 4.2 | 9.3 | 12 |
| d.bh | Dbh | m | 14 | 0.035 | 0.072 | 0.14 |
| h.bh | Height of d.bh measurement | m | 14 | 1.3 | 1.3 | 1.3 |
| d.cr | Crown width | m | 12 | 1.3 | 1.9 | 3.3 |
| m.lf | Leaf mass | kg | 14 | 0.09 | 1.4 | 5.8 |
| m.st | Total stem mass | kg | 14 | 1.6 | 9.3 | 33 |
| m.so | Aboveground mass | kg | 14 | 1.7 | 11 | 39 |
| m.br | Branch mass | kg | 14 | 0.11 | 0.64 | 3.8 |
| m.rt | Total root mass | kg | 12 | 0.59 | 2.6 | 11 |
| m.to | Total mass | kg | 12 | 2.5 | 13 | 50 |

And locally within the country:

The sites sampled are:
| Location | Longitude | Latitude | Vegetation |
|---|---|---|---|
| Inabu, Aich, Japan | 137 | 35 | Temperate forest |
The growing conditions of sampled plants was:
| Location | growingCondition |
|---|---|
| Inabu, Aich, Japan | plantation unmanaged |
| Species | Family | Pft |
|---|---|---|
| Chamaecyparis obtusa | Cupressaceae | evergreen gymnosperm |
Sampling strategy: Tree density, mean tree height and mean stem diameter at breast height (1.3 m above the ground) of the plantation were 5826 trees ha -l, 9.8 m and 9.3 cm, respectively. We selected the sample trees for spanning the size class distribution of the plantation.
Leaf area: Fresh weight of leaves contained in each 1.0 m (for larger trees) or 0.5 m (for smaller trees) thick horizontal layers was measured. Area of leaf samples taken from each layer was determined with an area metre. The foliage weight was finally converted into foliage area using the resulting specific leaf area.
Stem cross sectional area: We measured the diameter of stem including bark.
Height: We measured the real height after felling the sample trees.
Crown area: The area of the vertical projection of the outermost perimeter of the crown on the horizontal plane.
Biomass: We measured separately the mass of branches, stems, leaves, and roots.
Traits: Specific leaf area was calculated as a ratio of sample leaf area to sample leaf fresh weight.
Growth environment: Plantation unmanaged.
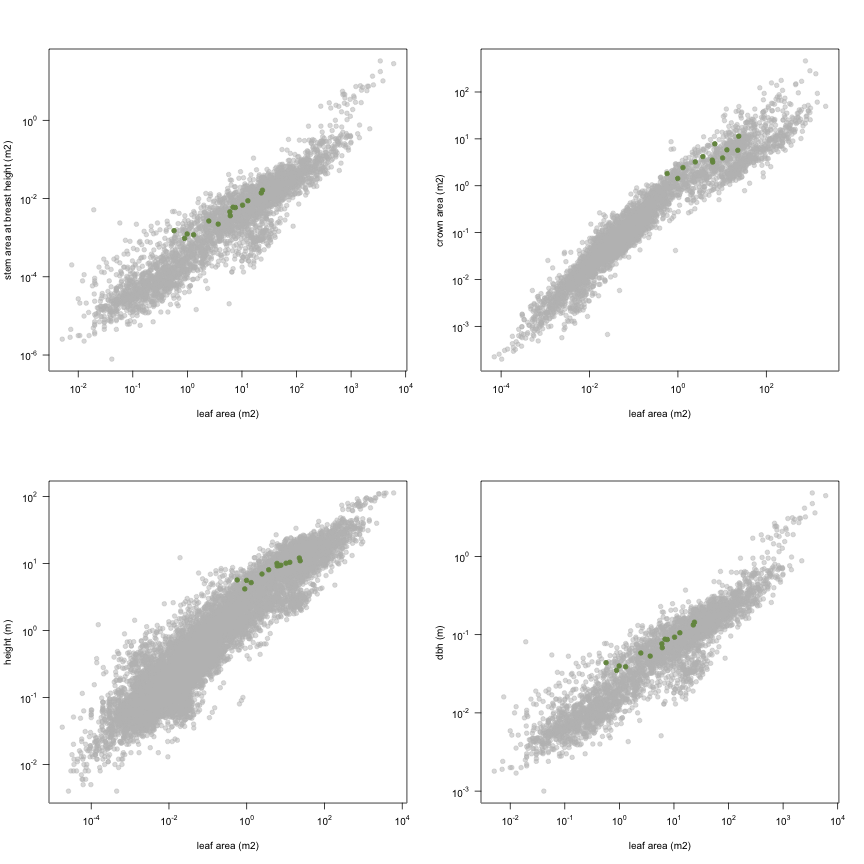
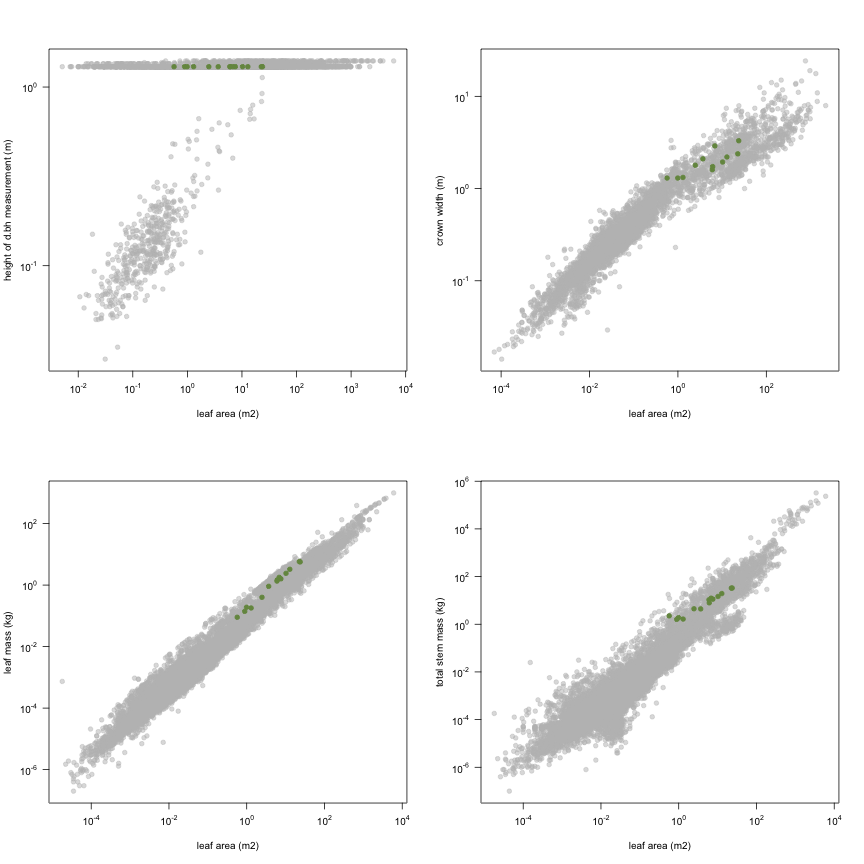
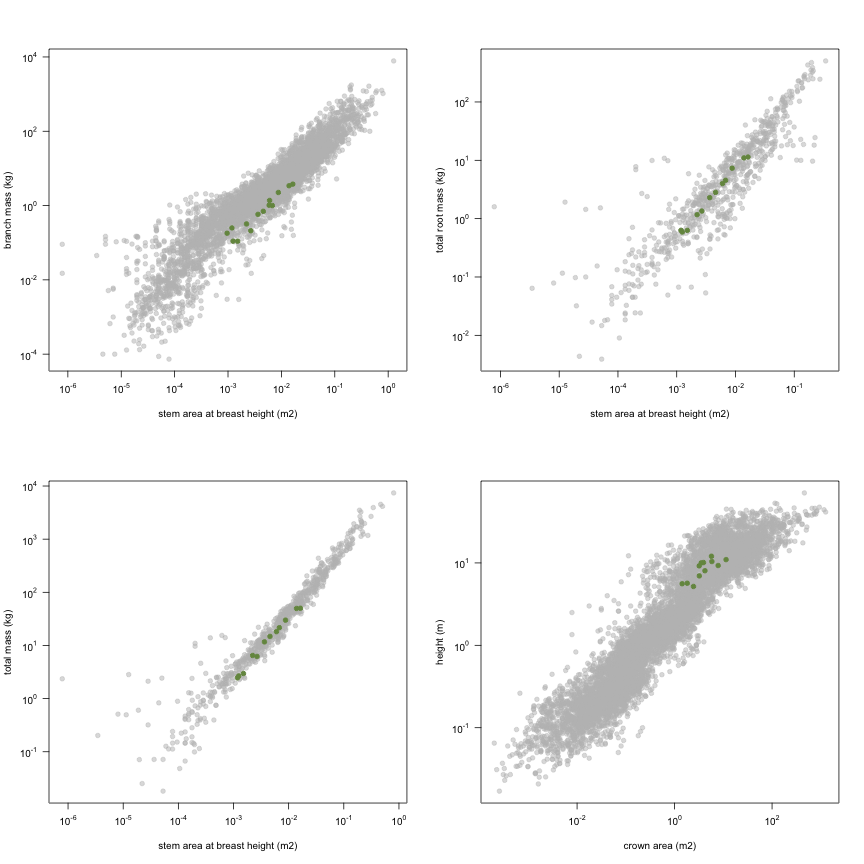
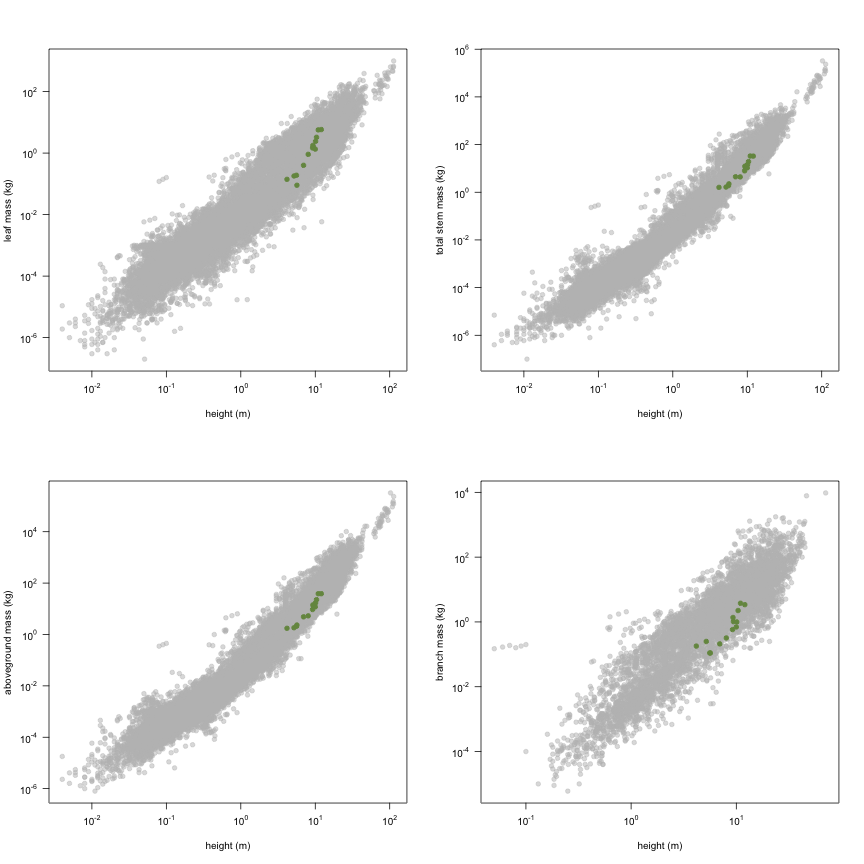
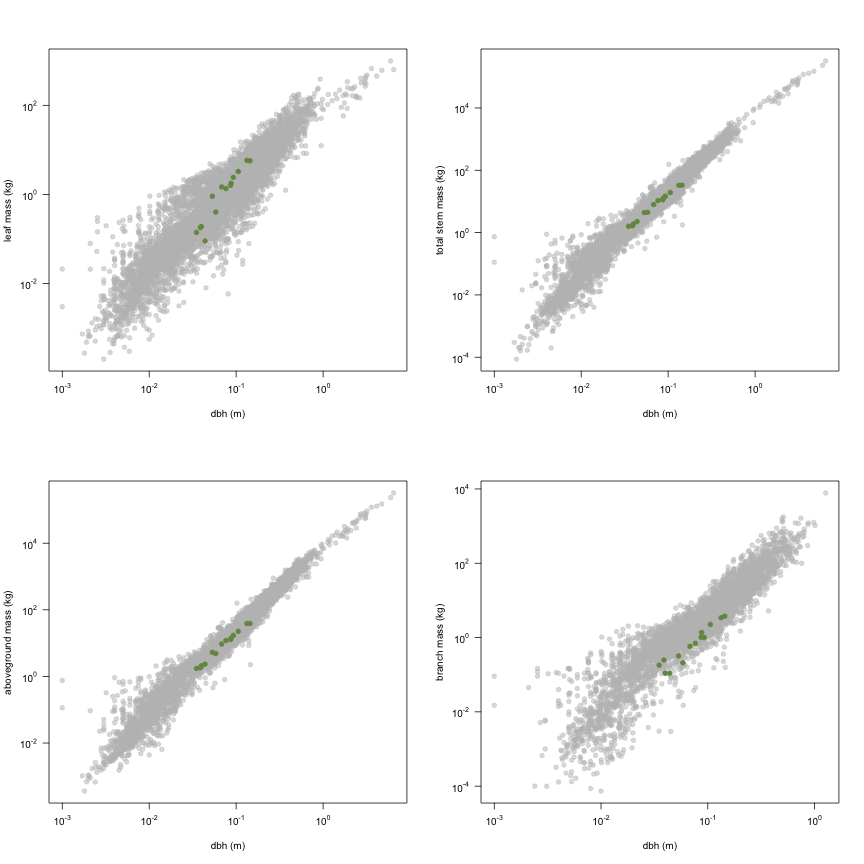
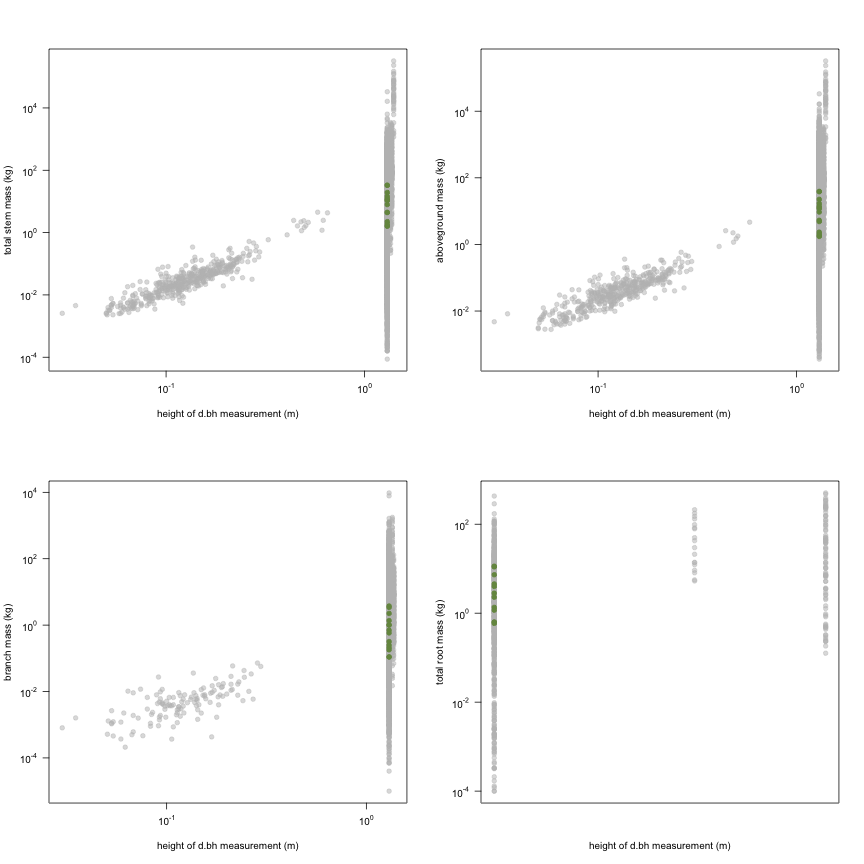
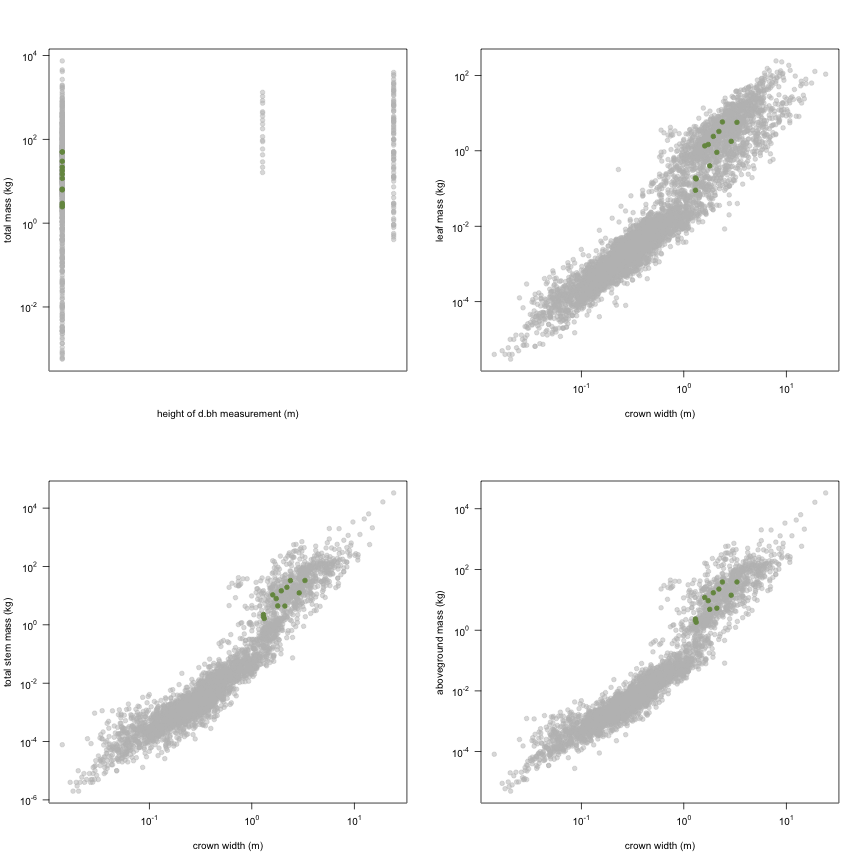
This is how the study Mori1991 fits in the entire dataset (grey). each colour represents a species. A legend of species names with colours is included at the end for reports with 1 < n < 20 species.