Lusk0000b
Data contributor: Christopher H. Lusk
Email: [email protected]
Address:
- School of Science, University of Waikato, Private 3105, Hamilton, New Zealand
Citation: Lusk CH (Unpublished).
DOI:
Abstract:
The dataset includes records for 32 individuals from 3 species belonging to 1 family(ies), presenting 1 functional type(s), growing in 1 condition(s) within 1 major type(s) of habitat, with data included for the following variables:
| Variable | Label | Units | N | Min | Median | Max |
|---|---|---|---|---|---|---|
| latitude | Latitude | deg | 32 | -38 | -38 | -38 |
| longitude | Longitude | deg | 32 | 175 | 175 | 175 |
| a.lf | Leaf area | m2 | 32 | 0.0016 | 0.0073 | 0.19 |
| h.t | Height | m | 32 | 0.035 | 0.083 | 0.29 |
| m.lf | Leaf mass | kg | 32 | 0.00026 | 0.00088 | 0.011 |
| m.st | Total stem mass | kg | 32 | 0.000045 | 0.00029 | 0.0032 |
| m.so | Aboveground mass | kg | 32 | 0.00031 | 0.0012 | 0.014 |
| m.rt | Total root mass | kg | 32 | 0.000076 | 0.00058 | 0.0071 |
| m.to | Total mass | kg | 32 | 0.0004 | 0.0022 | 0.021 |

And locally within the country:

The sites sampled are:
| Location | Longitude | Latitude | Vegetation |
|---|---|---|---|
| Glasshouse in New Zealand | 175.3139 | -37.7869 |
The growing conditions of sampled plants was:
| Location | growingCondition |
|---|---|
| Glasshouse in New Zealand | glasshouse |
| Species | Family | Pft |
|---|---|---|
| Pseudopanax arboreus | Araliaceae | evergreen angiosperm |
| Pseudopanax crassifolius | Araliaceae | evergreen angiosperm |
| Schefflera digitata | Araliaceae | evergreen angiosperm |
Sampling strategy: We obtained 200 - 350 mm tall seedlings from commercial sources and grew them in a glasshouse for 105 days. Crown architecture of each seedling was recorded using a using a FASTRAK 3D-digitizer (Polhemus, Colchester, VT, USA), in conjunction with the software package FLORADIG (CSIRO Entomology, Brisbane, Australia).
Leaf area: The total foliage area of each plant was measured using a LI-3100 leaf Area Meter
Stem cross sectional area: Basal stem diameter (immediately above any root flanges) was measured on two orthogonal axis, using electronic callipers.
Height: Height was measured as the length of the longest stem, from the ground to the apex.
Crown area: Crown area was computed from the plant architecture data obtained using the 3D digitizer.
Biomass: Plants were divided into stem, leaf and root fractions and then dried to a constant weight. Petioles of simple leaves were included in total leaf mass. Petioles of compound leaves were included in the stem fraction.
Growth environment: Nursery-sourced plants grown in glasshouse with ~ 20% light.
Other variables: Relative growth rates of stem height and volume were measured. Transverse sections were taken from base of each stem to measure vessel diameters and densities. Theoretical sapwood conductivity was then computed from the xylem anatomy data. Actual measurements of sapwood conductivity were also carried out.
Year collected: 2012
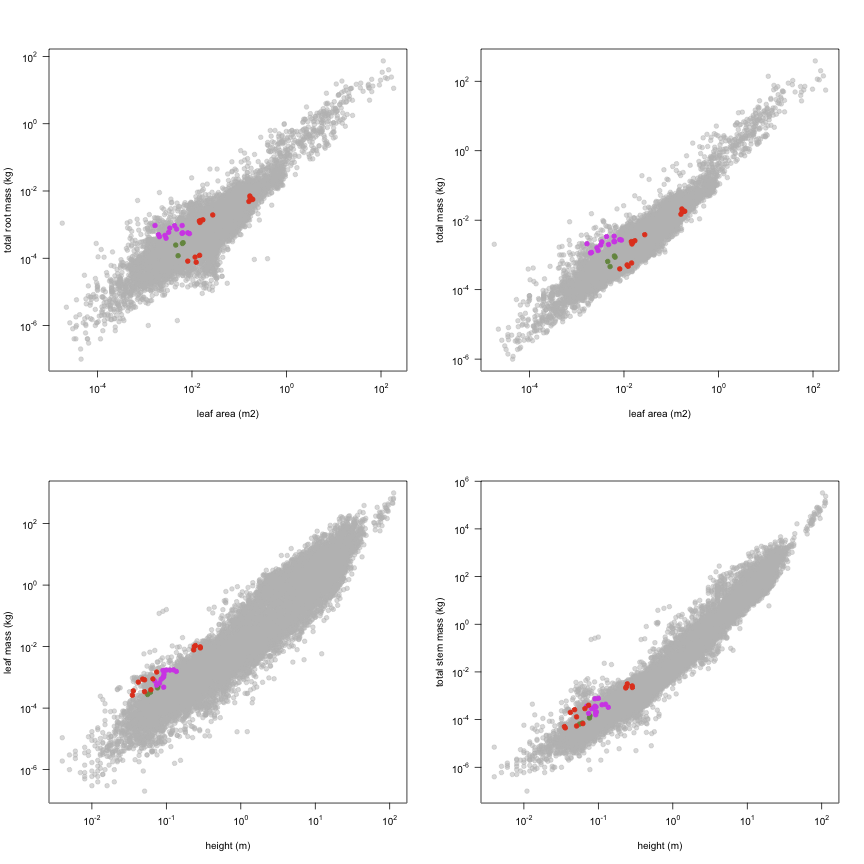
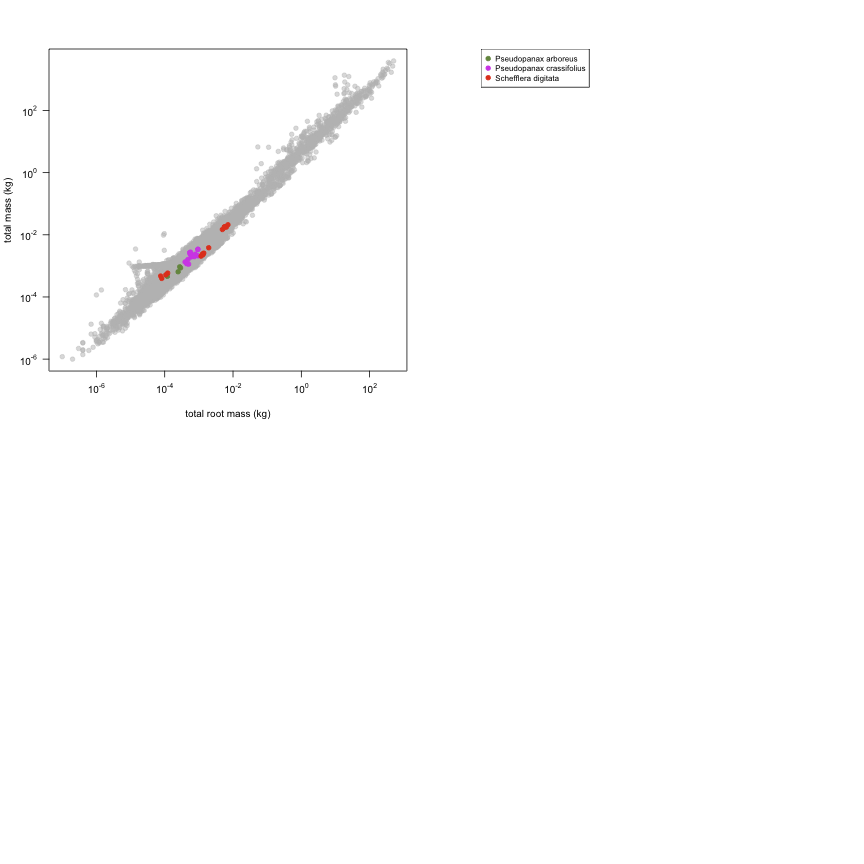
This is how the study Lusk0000b fits in the entire dataset (grey). each colour represents a species. A legend of species names with colours is included at the end for reports with 1 < n < 20 species.