Selaya2010
Data contributor: Niels Anten, N. Galia Selaya
Email: [email protected], [email protected]
Address:
- Centre for Crop Systems Analysis, Wageningen UR, The Netherlands
- PROMAB: Programa de Manejo de Bosques de la Amazonia Boliviana, Riberalta, Bolivia
Citation: Selaya NG and Anten NPR (2010). 'Leaves of pioneer and later-successional trees have similar lifetime carbon gain in tropical secondary forest.' Ecology, 91, pp. 1102-1113.
DOI: 10.1890/08-2111.1
Abstract: Different life history strategies among tropical rain forest species are generally related to inherent trade-offs in leaf and crown traits, with early-successional species having traits that facilitate high productivity but a relatively wasteful use of resources and shade-tolerant later-successional species exhibiting the opposite strategy. But the degree to which these trait differences contribute to short- and long-term carbon gain of different species that coexist in natural forest has not been quantitatively scaled. We applied a canopy model in combination with measurements of canopy structure, mass distribution, and leaf photosynthesis to determine whole-plant daily photosynthesis (Ppl) of individuals of three short-lived pioneers (SLP), four later-successional species, and three lianas growing together in a 0.5-, 2-, and 3-yr-old secondary tropical forest stand. Whole-plant daily photosynthesis per unit leaf mass (Plfm) and aboveground mass (Pm) were assumed to indicate daily returns on investment at the leaf and crown level. By integrating these calculations with measured leaf longevities, we determined the lifetime carbon gain per unit leaf mass. Vegetation height and leaf area index increased with stand age. Two of the SLPs, Trema and Ochroma, increasingly dominated the top of the vegetation. In the 0.5-yr-old stand, these species also had the highest Pm and Plfm values. Whole-plant daily photosynthesis per unit leaf mass tended to decline with stand age but much more strongly so in the later-successional species than in the SLP. Leaf longevity was not significantly correlated with individual leaf traits (e.g., specific leaf area or leaf N content) but was strongly and negatively correlated with Plfm in the youngest stand. Later-successional species had considerably greater leaf longevities than SLP. Lifetime carbon gain per unit leaf mass, however, was relatively similar between the different species. Thus due to the strong negative correlation that exists between daily leaf productivity (Plfm) and longevity, short-lived pioneers and later-successional species achieve similar lifetime carbon gain per unit leaf mass in natural secondary forest. This could help explain why the slower-growing later-successional species are able to persist during the first years of succession.
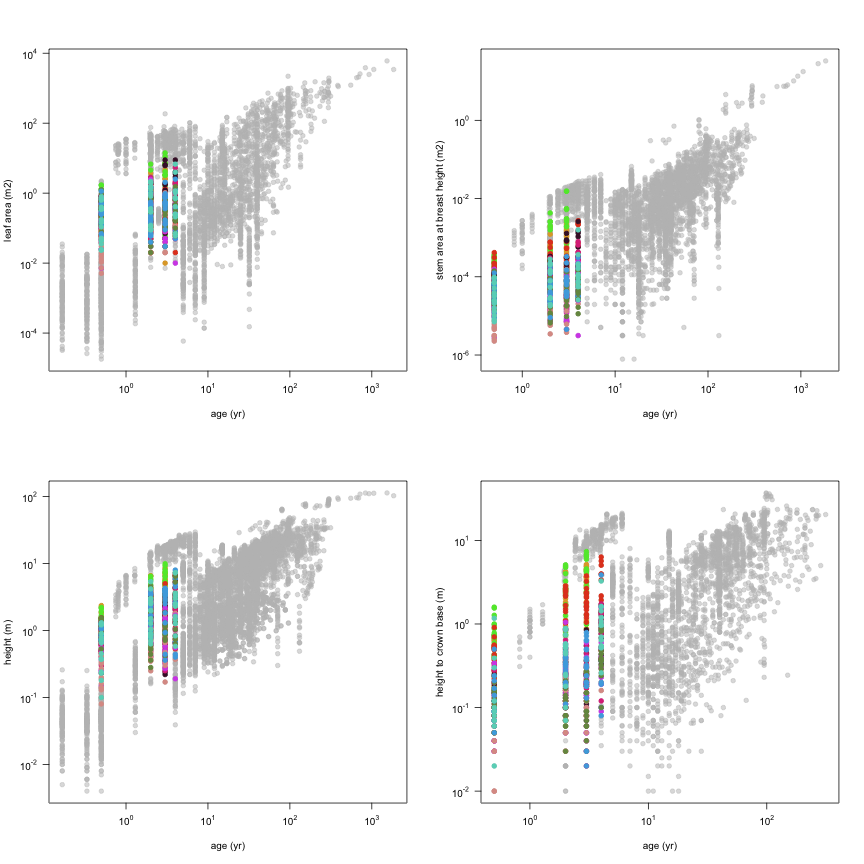
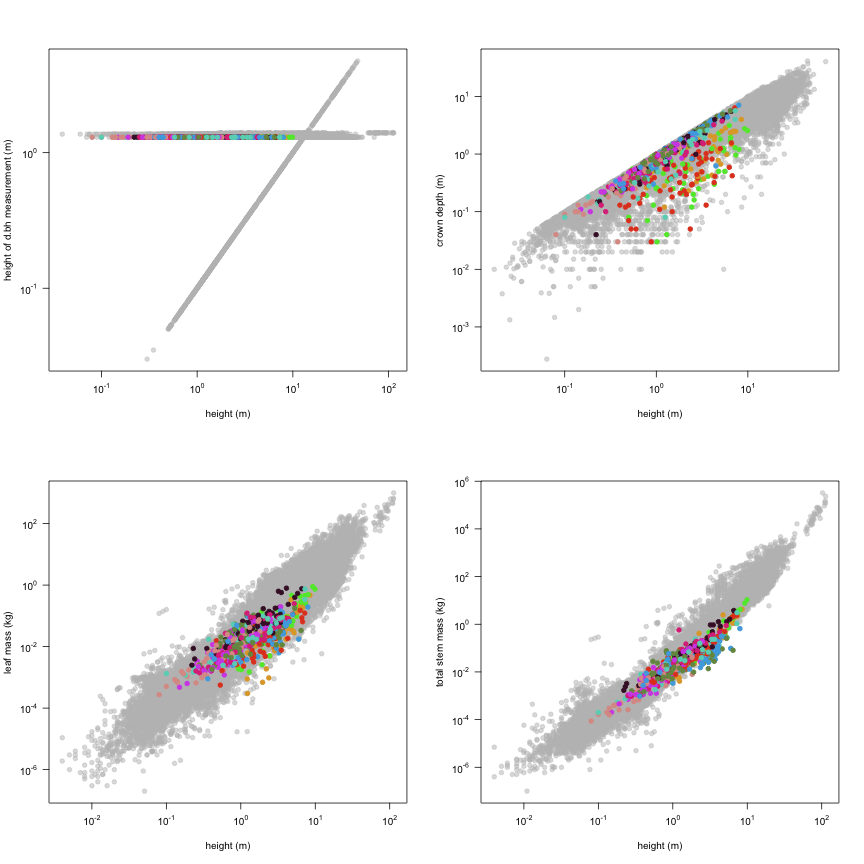
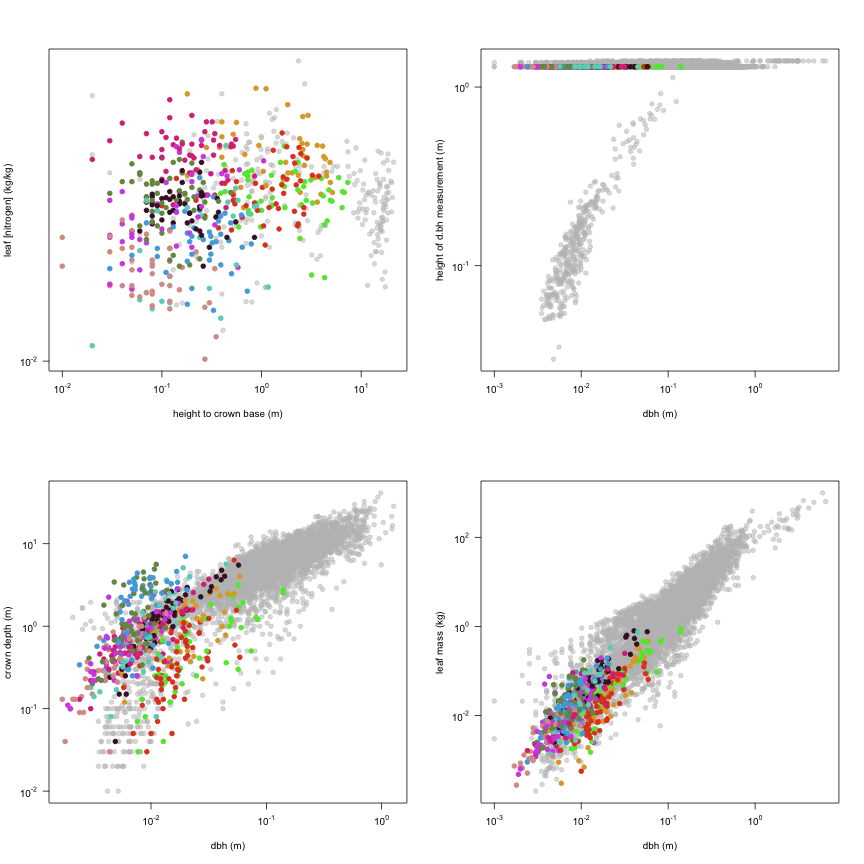
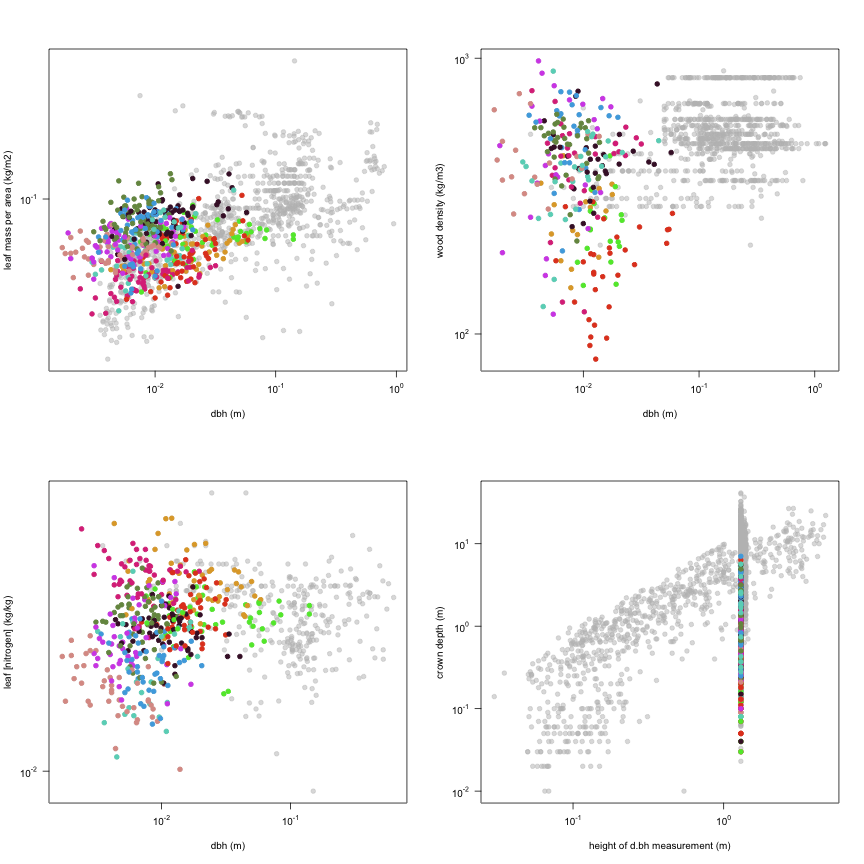
The dataset includes records for 630 individuals from 10 species belonging to 9 family(ies), presenting 1 functional type(s), growing in 1 condition(s) within 1 major type(s) of habitat, with data included for the following variables:
| Variable | Label | Units | N | Min | Median | Max |
|---|---|---|---|---|---|---|
| latitude | Latitude | deg | 630 | -11 | -11 | -11 |
| longitude | Longitude | deg | 630 | -66 | -66 | -66 |
| age | Age | yr | 630 | 0.5 | 2 | 4 |
| a.lf | Leaf area | m2 | 592 | 0.0051 | 0.3 | 14 |
| a.stbh | Stem area at breast height | m2 | 590 | 0.0000023 | 0.000069 | 0.015 |
| h.t | Height | m | 594 | 0.08 | 1.3 | 9.9 |
| h.c | Height to crown base | m | 578 | 0 | 0.29 | 7.4 |
| d.bh | Dbh | m | 590 | 0.0017 | 0.0094 | 0.14 |
| h.bh | Height of d.bh measurement | m | 630 | 1.3 | 1.3 | 1.3 |
| c.d | Crown depth | m | 578 | 0.03 | 0.76 | 7 |
| m.lf | Leaf mass | kg | 596 | 0.00027 | 0.018 | 0.89 |
| m.st | Total stem mass | kg | 596 | 0.000087 | 0.028 | 11 |
| m.so | Aboveground mass | kg | 596 | 0.00036 | 0.048 | 11 |
| m.br | Branch mass | kg | 278 | 0 | 0.0052 | 1.1 |
| a.ilf | Area of individual leaf | m2 | 630 | 0.0027 | 0.0064 | 0.15 |
| ma.ilf | Leaf mass per area | kg m-2 | 573 | 0.027 | 0.062 | 0.13 |
| r.st | Wood density | kg m-3 | 261 | 81 | 403 | 978 |
| n.lf | Leaf [nitrogen] | kg kg-1 | 473 | 0.01 | 0.022 | 0.039 |

And locally within the country:

The sites sampled are:
| Location | Longitude | Latitude | Vegetation |
|---|---|---|---|
| Riberalta, Bolivian Amazon | -66 | -11 | Tropical rainforest |
The growing conditions of sampled plants was:
| Location | Grouping | growingCondition |
|---|---|---|
| Riberalta, Bolivian Amazon | grouping = secondary forest 6 mo | plantation unmanaged |
| Riberalta, Bolivian Amazon | grouping = secondary forest 2 yo | plantation unmanaged |
| Riberalta, Bolivian Amazon | grouping = secondary forest 3 yo | plantation unmanaged |
| Riberalta, Bolivian Amazon | grouping = secondary forest 4 yo | plantation unmanaged |
| Species | Family | Pft |
|---|---|---|
| Trema micrantha | Ulmaceae | evergreen angiosperm |
| Ochroma pyramidale | Malvaceae | evergreen angiosperm |
| Cecropia ficifolia | Urticaceae | evergreen angiosperm |
| Couratari guianensis | Lecythidaceae | evergreen angiosperm |
| Rinereocarpus uleii | Violaceae | evergreen angiosperm |
| Brosimum lactescens | Moraceae | evergreen angiosperm |
| Pseudolmedia laevis | Moraceae | evergreen angiosperm |
| Adenocalymma impressum | Bignoniaceae | evergreen angiosperm |
| Combretum gracilis | Combretacea | evergreen angiosperm |
| Uncaria guianensis | Rubiaceae | evergreen angiosperm |
Sampling strategy: A plot of 0.7 ha was established in a 0.5, 2 and 3 y/o secondary forest at a minimal distance of 20 m from the edge of this forest stand (beyond this there was primary forest). Ten to 20 individuals (all had grown from seed) per species were selected such that bracketed the height range at which each occurred in the plot.
Leaf area: Digital photographs of representative leaves were taken and scanned for leaf area using the software Sigma Scan Pro 5. The leaves were then dried at 70oC for 5 days to obtain SLA. Specific leaf area was used to calculate total leaf area.
Stem cross sectional area: Calculated from diameter measurements at .3 and 1.3 m height
Height: Destructively : trees were cut at the base allowing direct height measurements
Crown area: Crown diameter was measured visually in two directions
Biomass: Individuals were harvested and clipped into 25 cm sections. Stem branches, petioles and foliage were put in separate bags and dried at 70oC for 5 days.
Traits: Wood density: green volume by water displacement and then dry weight; Leaf angle using protractor; Leaf N content with Kjehldahl method; Tree LAI measured with a LI2000.
Growth environment: Light measurements using quantum sensors and relative light distribution in the canopy calculated from the leaf area distribution measured using the point method (i.e. raising a telescopic pole and counting leaf contacts)
Year collected: 2003
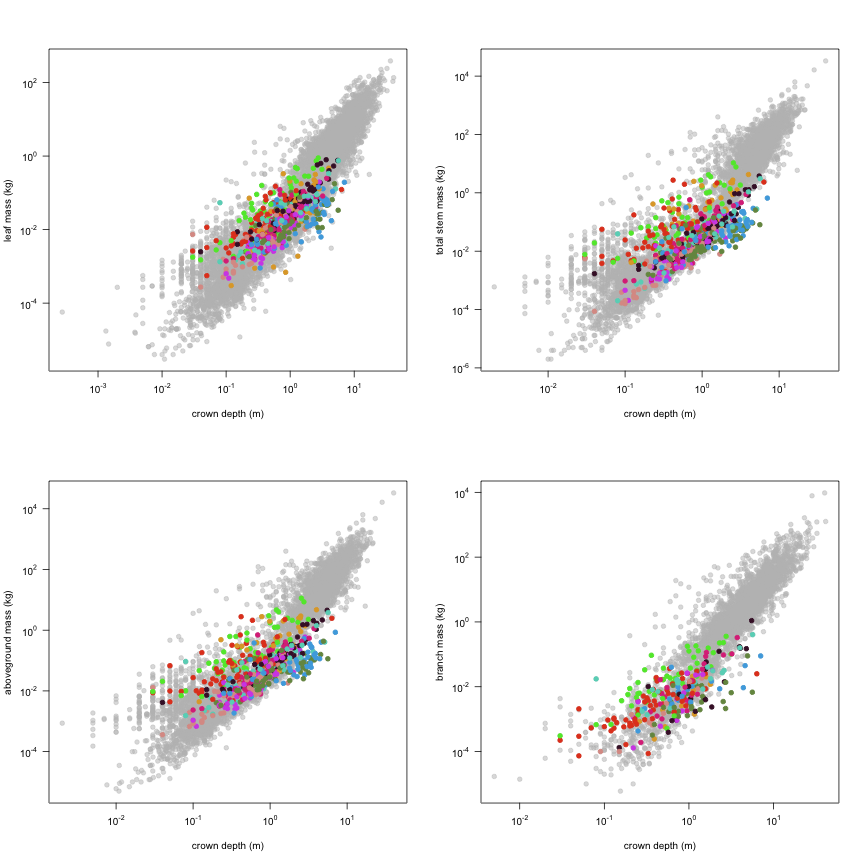
This is how the study Selaya2010 fits in the entire dataset (grey). each colour represents a species. A legend of species names with colours is included at the end for reports with 1 < n < 20 species.