Wang1996
Data contributor: Jian R. Wang
Email: [email protected]
Address:
- Faculty of Natural Resources Management, Lakehead University, Thunder Bay, ON P7B 5E1, Canada
Citation: Wang J, Zhong A, Simard S and Kimmins J (1996). 'Aboveground biomass and nutrient accumulation in an age sequence of paper birch (Betula papyrifera) in the Interior Cedar Hemlock zone, British Columbia.' Forest Ecology and Management, 83(1-2), pp. 27-38.
DOI: 10.1016/0378-1127(96)03703-6
Abstract: The aboveground biomass and nutrient content (N, P, K, Ca, Mg) of stands of Betula papyrifera Marsh, aged 2, 8, 15, 45, 60, 75 years were measured in the Thompson Moist Warm Interior Cedar Hemlock variant ({ICHmw3)} of the southern interior of British Columbia. For four of these ages (2, 8, 60 and 75 years) measurements were made on good, medium and poor sites. For the other two ages, only stands on good sites coulde be located. Allometric equations relating dry weights of stemwood, stembark, branches and leaves to tree diameter at breast height ({DBH)} were developed to estimate aboveground tree biomass. Equations were not significantly different among the three site qualities. Average total aboveground tree biomass for all sites increased with stand age from 1.4 t ha-1 in 2-year-old stands (varying from 0.45 to 2.1 t ha-1 on poor and good sites, respectively) to 202 t ha-1 in the 75-year-old stand (156 and 234 t ha-1 on poor and good sites, respectively). As stand age increased, an increasing proportion of annual biomass increment was allocated to stems, but nutrients were preferentially accumulated in the leaves. Nutrient content of aboveground tree biomass increased with stand age and was generally in the order of N > Ca > K > Mg > P. Average rates of nutrients accumulation in biomass were greatest in the early stages of stand development, and less marked as stands aged. The concentrations of nutrients in tissues decreased in the following order: leaf > branch > stembark > stemwood. Understory minor vegetation contributed little to the nutrient pool of these paper birch ecosystems. Mineral soil contained the largest amount of nutrients among the various ecosystem components.
The dataset includes records for 74 individuals from 1 species belonging to 1 family(ies), presenting 1 functional type(s), growing in 1 condition(s) within 1 major type(s) of habitat, with data included for the following variables:
| Variable | Label | Units | N | Min | Median | Max |
|---|---|---|---|---|---|---|
| latitude | Latitude | deg | 74 | 53 | 53 | 53 |
| longitude | Longitude | deg | 74 | -122 | -122 | -122 |
| a.stbh | Stem area at breast height | m2 | 74 | 0.000095 | 0.0017 | 0.093 |
| h.t | Height | m | 74 | 1.1 | 5.6 | 27 |
| d.bh | Dbh | m | 74 | 0.011 | 0.047 | 0.34 |
| h.bh | Height of d.bh measurement | m | 74 | 1.3 | 1.3 | 1.3 |
| m.lf | Leaf mass | kg | 74 | 0.0031 | 0.47 | 27 |
| m.sb | Bark mass | kg | 74 | 0.0061 | 0.38 | 74 |
| m.st | Total stem mass | kg | 74 | 0.048 | 3 | 657 |
| m.so | Aboveground mass | kg | 74 | 0.073 | 3.7 | 684 |
| m.br | Branch mass | kg | 74 | 0.015 | 0.67 | 70 |

And locally within the country:
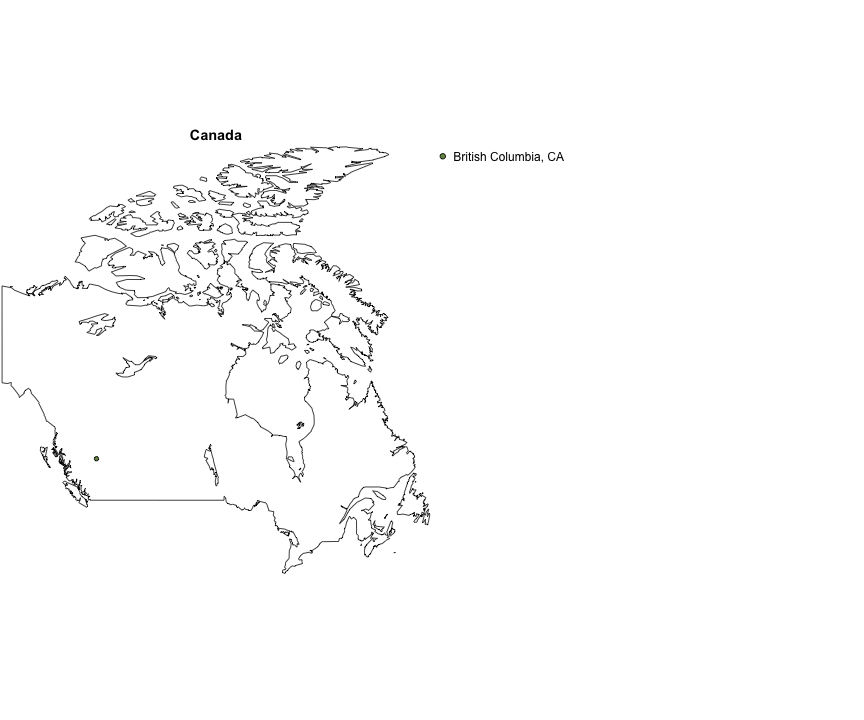
The sites sampled are:
| Location | Longitude | Latitude | Vegetation |
|---|---|---|---|
| British Columbia, CA | -121.5 | 53 | Boreal forest |
The growing conditions of sampled plants was:
| Location | growingCondition |
|---|---|
| British Columbia, CA | field wild |
| Species | Family | Pft |
|---|---|---|
| Betula papyrifera Marsh | Betulaceae | deciduous angiosperm |
Sampling strategy: Sample trees are collected from an age chronosequency of Betula papyrifera natural stands. The sampled stands represent the whole range of site conditions of the species distribution; i.e. from poor to medium and good site productivity. All sample trees were dominant trees.
Leaf area: Leaf area was not measured. However, we can calculate the leaf area by using specific leaf area of Betula papyrifera to convert the leaf biomass data into leaf area data.
Stem cross sectional area: We can calculate stem cross sectional area by using the diameter at breast height.
Height: Because all sample trees were at different ages, they have different height.
Year collected: 1991-1992
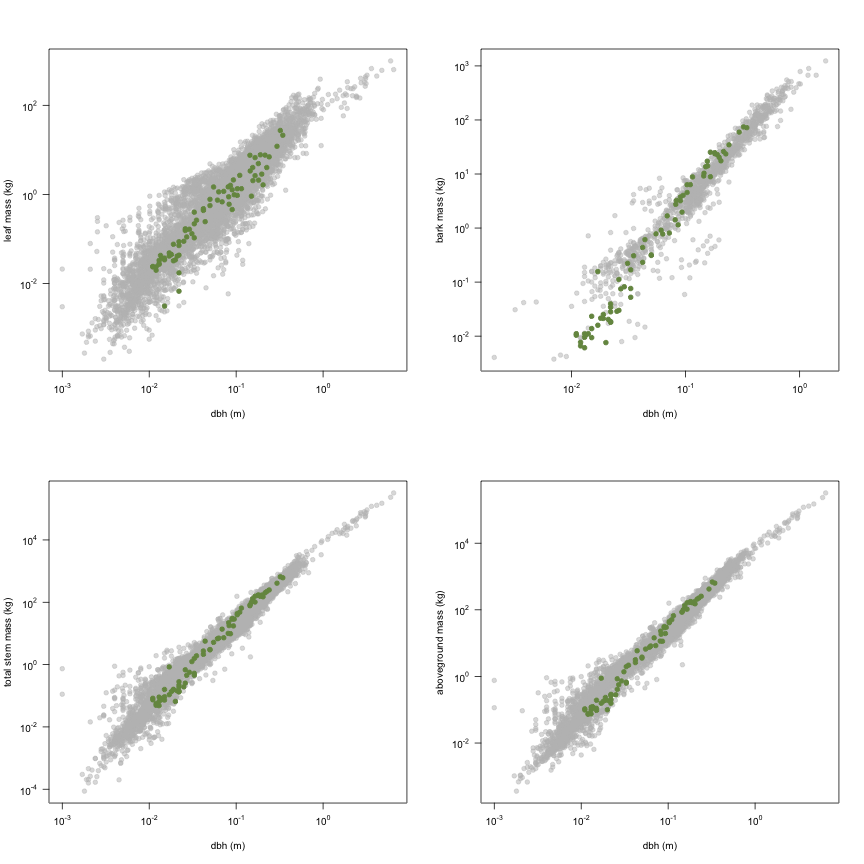
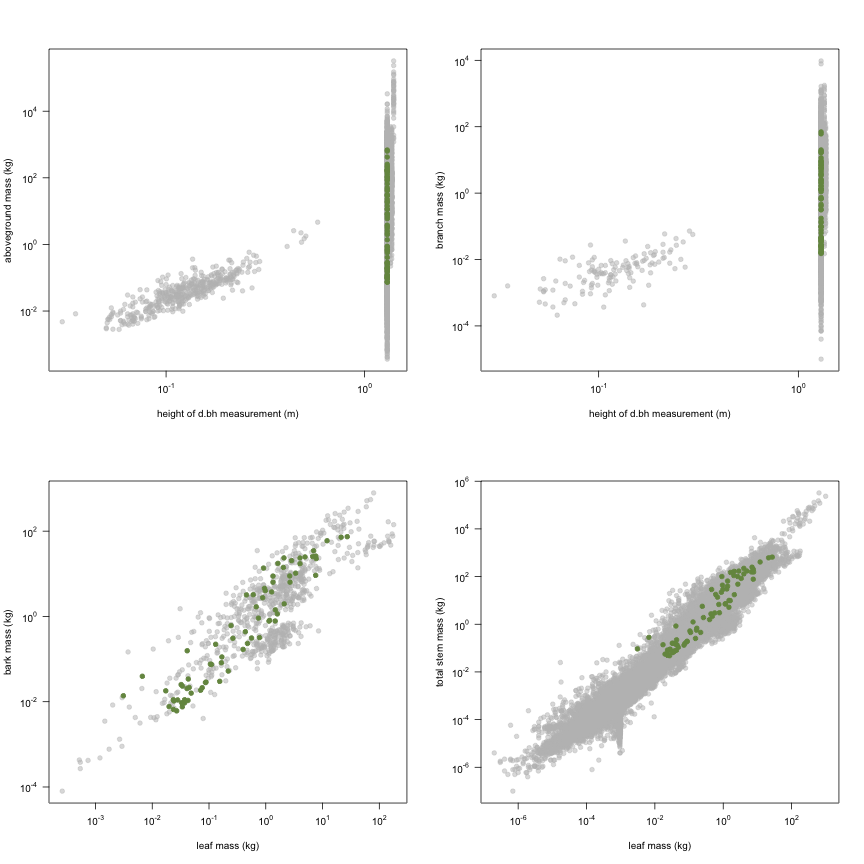
This is how the study Wang1996 fits in the entire dataset (grey). each colour represents a species. A legend of species names with colours is included at the end for reports with 1 < n < 20 species.